

Allosteric transition pathways in the lactose repressor protein core domains: asymmetric motions in a homodimer
- PMID: 14573864
- PMCID: PMC2366968
- DOI: 10.1110/ps.03188303
Allosteric transition pathways in the lactose repressor protein core domains: asymmetric motions in a homodimer
Abstract
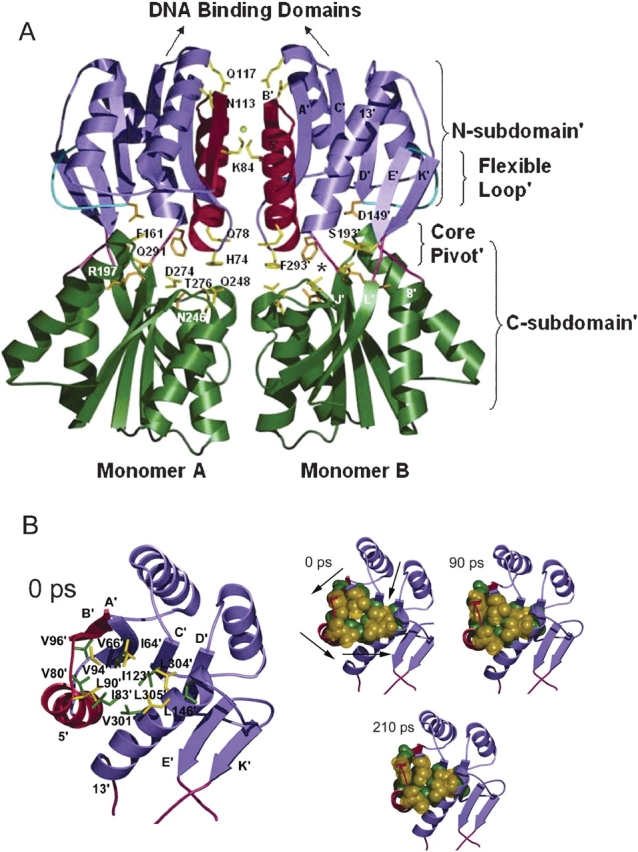
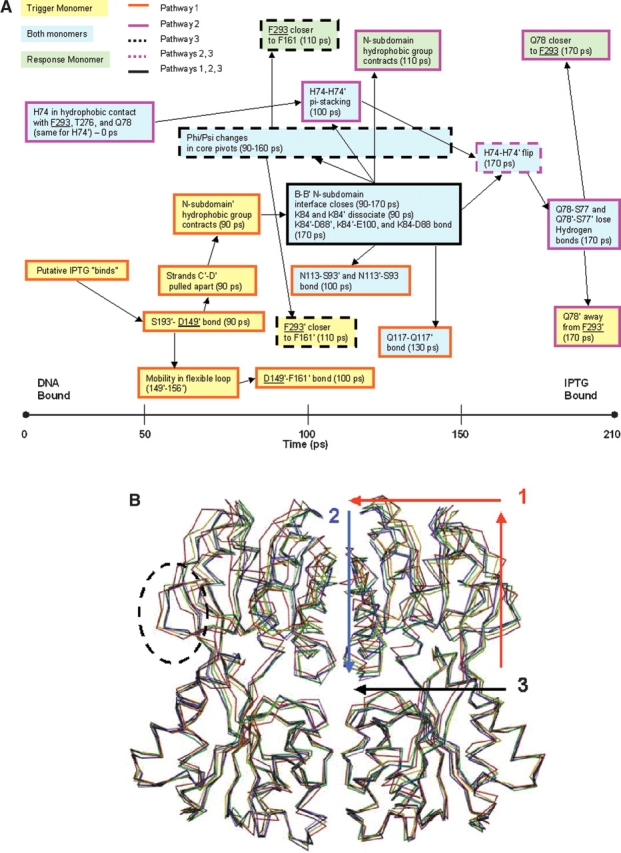
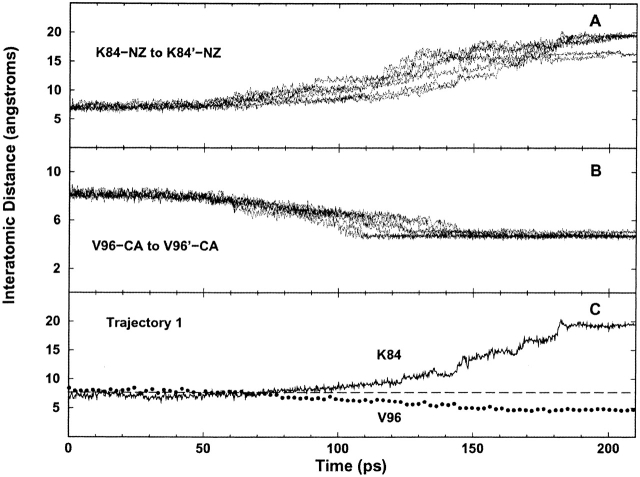
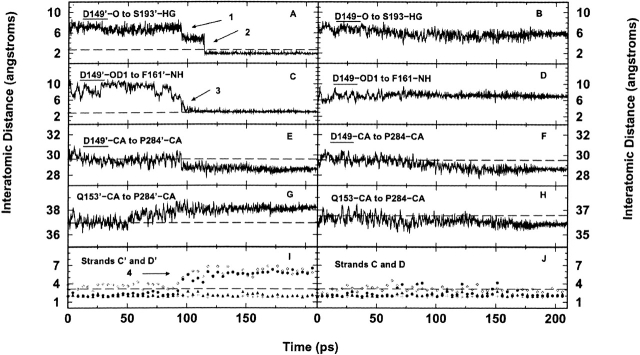
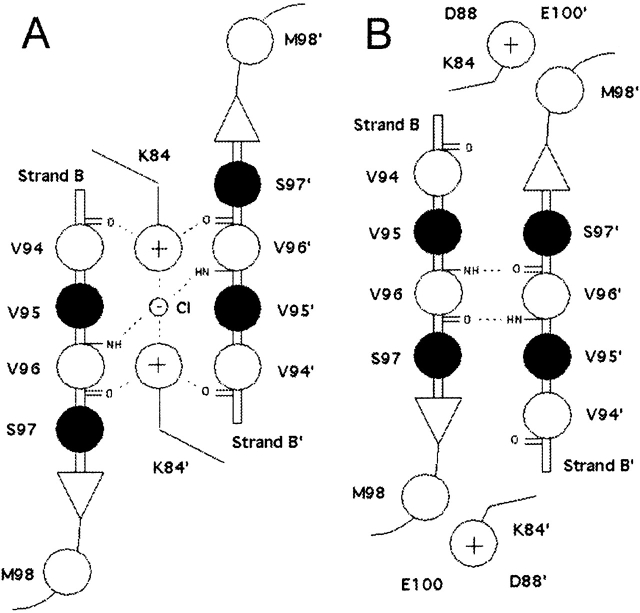
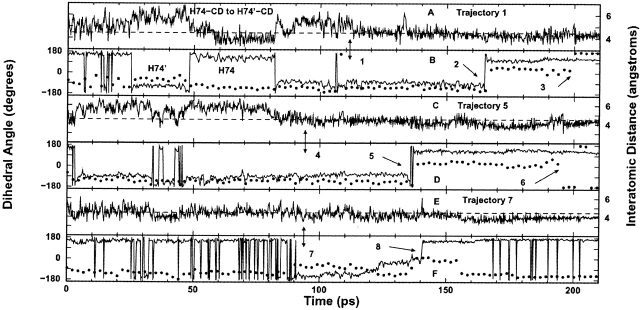
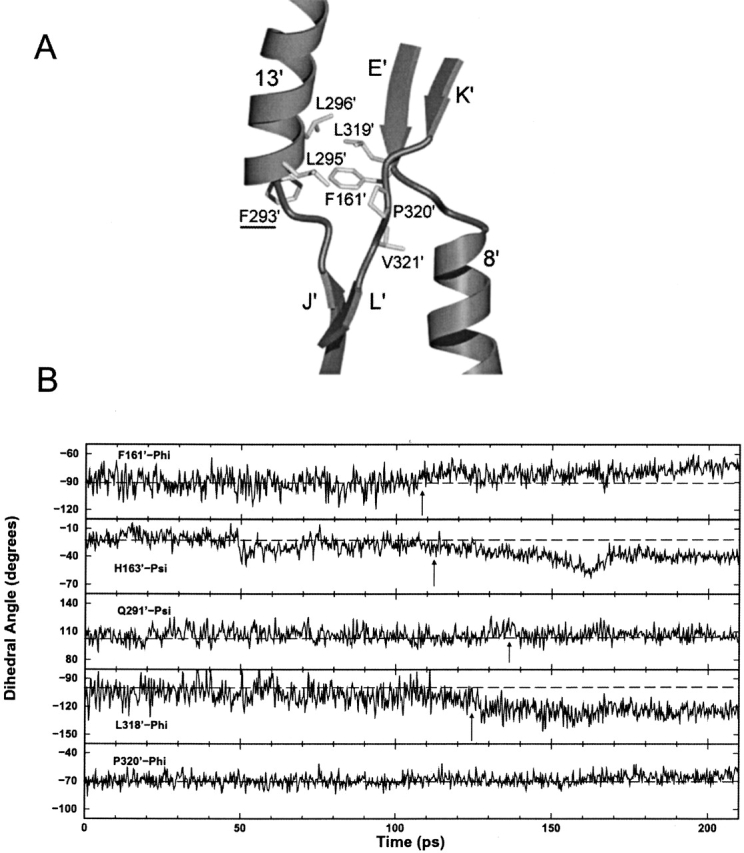
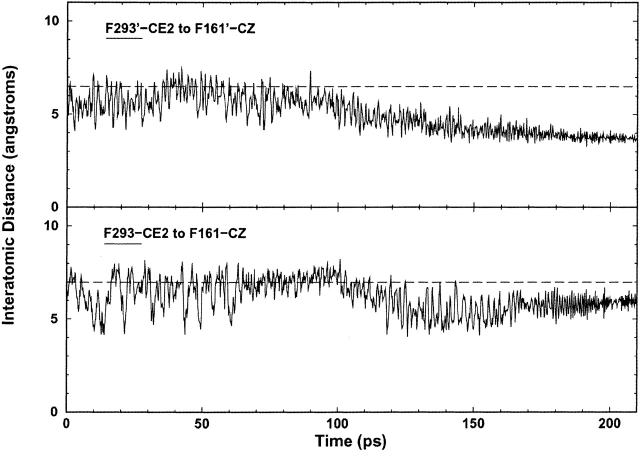
The crystal structures of lactose repressor protein (LacI) provide static endpoint views of the allosteric transition between DNA- and IPTG-bound states. To obtain an atom-by-atom description of the pathway between these two conformations, motions were simulated with targeted molecular dynamics (TMD). Strikingly, this homodimer exhibited asymmetric dynamics. All asymmetries observed in this simulation are reproducible and can begin on either of the two monomers. Asymmetry in the simulation originates around D149 and was traced back to the pre-TMD equilibrations of both conformations. In particular, hydrogen bonds between D149 and S193 adopt a variety of configurations during repetitions of this process. Changes in this region propagate through the structure via noncovalent interactions of three interconnected pathways. The changes of pathway 1 occur first on one monomer. Alterations move from the inducer-binding pocket, through the N-subdomain beta-sheet, to a hydrophobic cluster at the top of this region and then to the same cluster on the second monomer. These motions result in changes at (1) side chains that form an interface with the DNA-binding domains and (2) K84 and K84', which participate in the monomer-monomer interface. Pathway 2 reflects consequent reorganization across this subunit interface, most notably formation of a H74-H74rsquo; pi-stacking intermediate. Pathway 3 extends from the rear of the inducer-binding pocket, across a hydrogen-bond network at the bottom of the pocket, and transverses the monomer-monomer interface via changes in H74 and H74rsquo;. In general, intermediates detected in this study are not apparent in the crystal structures. Observations from the simulations are in good agreement with biochemical data and provide a spatial and sequential framework for interpreting existing genetic data.
Figures
Similar articles
-
Fine-tuning function: correlation of hinge domain interactions with functional distinctions between LacI and PurR.Protein Sci. 2002 Apr;11(4):778-94. doi: 10.1110/ps.4050102. Protein Sci. 2002. PMID: 11910022 Free PMC article.
-
Flexibility in the inducer binding region is crucial for allostery in the Escherichia coli lactose repressor.Biochemistry. 2009 Jun 9;48(22):4988-98. doi: 10.1021/bi9002343. Biochemistry. 2009. PMID: 19368358 Free PMC article.
-
A closer view of the conformation of the Lac repressor bound to operator.Nat Struct Biol. 2000 Mar;7(3):209-14. doi: 10.1038/73317. Nat Struct Biol. 2000. PMID: 10700279
-
The lac repressor.C R Biol. 2005 Jun;328(6):521-48. doi: 10.1016/j.crvi.2005.04.004. C R Biol. 2005. PMID: 15950160 Review.
-
Studying allosteric regulation in metal sensor proteins using computational methods.Adv Protein Chem Struct Biol. 2014;96:181-218. doi: 10.1016/bs.apcsb.2014.06.009. Epub 2014 Sep 6. Adv Protein Chem Struct Biol. 2014. PMID: 25443958 Review.
Cited by
-
Flexibility and Disorder in Gene Regulation: LacI/GalR and Hox Proteins.J Biol Chem. 2015 Oct 9;290(41):24669-77. doi: 10.1074/jbc.R115.685032. Epub 2015 Sep 4. J Biol Chem. 2015. PMID: 26342073 Free PMC article. Review.
-
Structure-based predictive models for allosteric hot spots.PLoS Comput Biol. 2009 Oct;5(10):e1000531. doi: 10.1371/journal.pcbi.1000531. Epub 2009 Oct 9. PLoS Comput Biol. 2009. PMID: 19816556 Free PMC article.
-
Amino acid positions subject to multiple coevolutionary constraints can be robustly identified by their eigenvector network centrality scores.Proteins. 2015 Dec;83(12):2293-306. doi: 10.1002/prot.24948. Epub 2015 Nov 17. Proteins. 2015. PMID: 26503808 Free PMC article.
-
Dynamics-based protein network features accurately discriminate neutral and rheostat positions.Biophys J. 2024 Oct 15;123(20):3612-3626. doi: 10.1016/j.bpj.2024.09.013. Epub 2024 Sep 13. Biophys J. 2024. PMID: 39277794
-
Allosteric transitions of supramolecular systems explored by network models: application to chaperonin GroEL.PLoS Comput Biol. 2009 Apr;5(4):e1000360. doi: 10.1371/journal.pcbi.1000360. Epub 2009 Apr 17. PLoS Comput Biol. 2009. PMID: 19381265 Free PMC article.
References
-
- Allen, M.P. and Tildesley, D.J. 1980. Computer simulation of liquids, pp. 78–82. Clarendon Press, Oxford.
-
- Barry, J.K. and Matthews, K.S. 1999. Substitutions at histidine 74 and aspartate 278 alter ligand binding and allostery in lactose repressor protein. Biochemistry 38 3579–3590. - PubMed
-
- Bell, C.E. and Lewis, M. 2000. A closer view of the conformation of the Lac repressor bound to operator. Nat. Struct. Biol. 7 209–214. - PubMed
-
- Bell, C.E., Barry, J., Matthews, K.S., and Lewis, M. 2001. Structure of a variant of lac repressor with increased thermostability and decreased affinity for operator. J. Mol. Biol. 313 99–109. - PubMed
-
- Berendsen, H.J.C., Postma, J.P.M., von Gunsteren, W.F., DiNola, A., and Haak, J.R. 1984. Molecular dynamics with coupling to an external bath. J. Chem. Phys. 81 3684–3690.
Publication types
MeSH terms
Substances
Grants and funding
LinkOut - more resources
Full Text Sources
Other Literature Sources
Research Materials
Miscellaneous
