. 2003 Oct 15:4:26.
doi: 10.1186/1471-2202-4-26.

Mapping perception to action in piano practice: a longitudinal DC-EEG study

Affiliations

Mapping perception to action in piano practice: a longitudinal DC-EEG study

Marc Bangert et al. BMC Neurosci. .

Abstract

Background: Performing music requires fast auditory and motor processing. Regarding professional musicians, recent brain imaging studies have demonstrated that auditory stimulation produces a co-activation of motor areas, whereas silent tapping of musical phrases evokes a co-activation in auditory regions. Whether this is obtained via a specific cerebral relay station is unclear. Furthermore, the time course of plasticity has not yet been addressed.

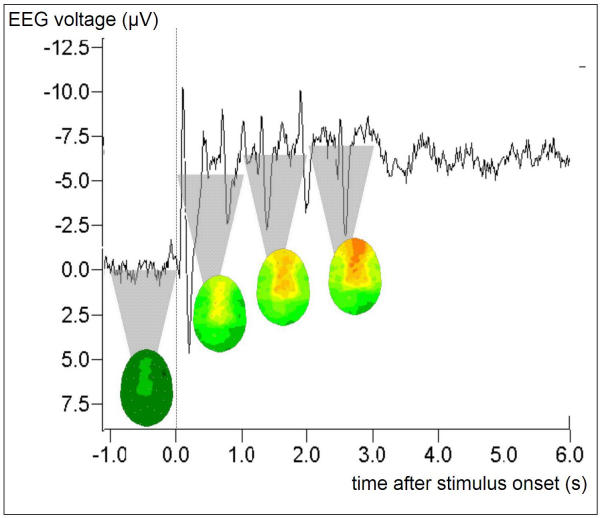
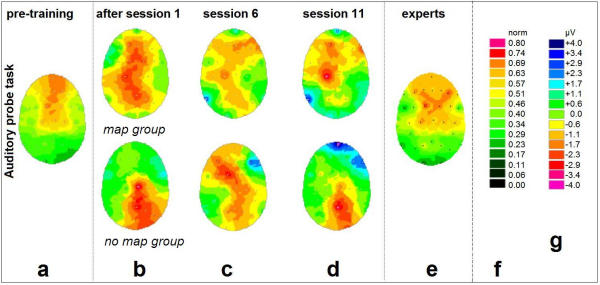
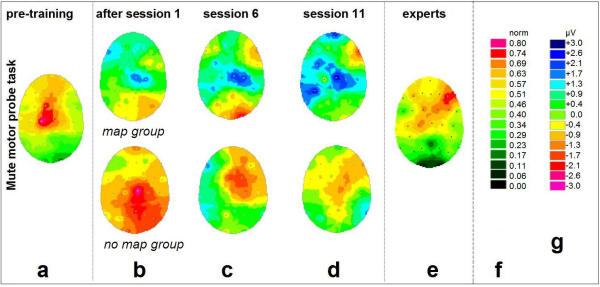
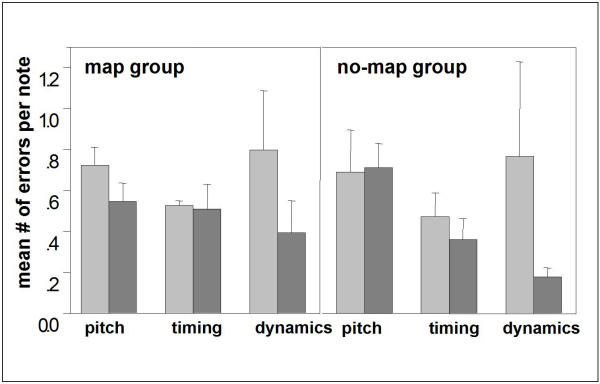
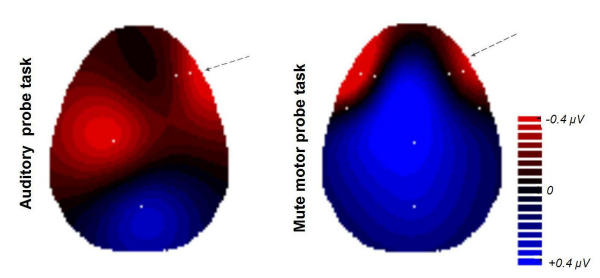
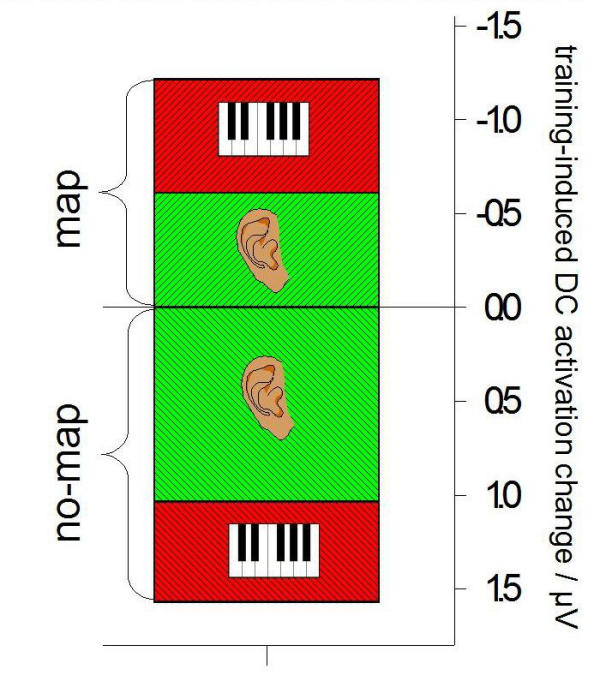
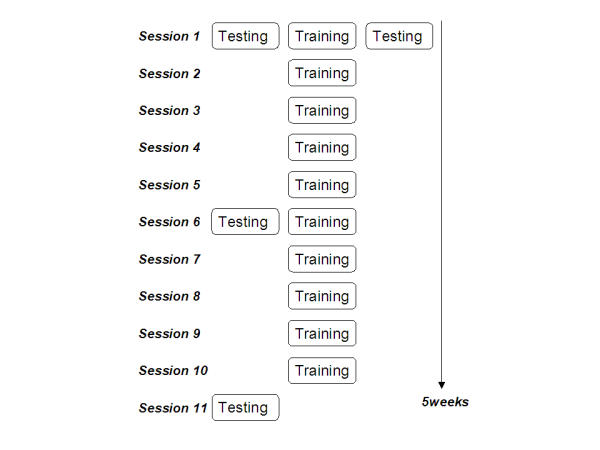
Results: Changes in cortical activation patterns (DC-EEG potentials) induced by short (20 minute) and long term (5 week) piano learning were investigated during auditory and motoric tasks. Two beginner groups were trained. The 'map' group was allowed to learn the standard piano key-to-pitch map. For the 'no-map' group, random assignment of keys to tones prevented such a map. Auditory-sensorimotor EEG co-activity occurred within only 20 minutes. The effect was enhanced after 5-week training, contributing elements of both perception and action to the mental representation of the instrument. The 'map' group demonstrated significant additional activity of right anterior regions.

Conclusion: We conclude that musical training triggers instant plasticity in the cortex, and that right-hemispheric anterior areas provide an audio-motor interface for the mental representation of the keyboard.


Figures

Figure 1
Figure 1
Task-related potential at electrode position FC3 during the presentation of the auditory probe task. Stimulus onset t = 0, stimulus end t = 3000 ms. Grand Average including nine subjects ('map' group) with > 45 single presentations each. The averaging process preserves the interindividually invariant signal components, such as the negative DC plateau and the superimposed ERP peaks (bimodal combination at a latency of 100 ms/200 ms + n * 600 ms) that are evoked by the single tones the stimulus is composed of. The top of the shaded triangles indicate the DC level that is obtained by time-averaging the signal over 1-second time windows; the resulting 30-electrode topographic interpolations are attached to the tips of the respective triangles. Statistical analysis and cortical imaging in the results section is based on the time window [1000 ms, 3000 ms] after stimulus onset.
Figure 2
Figure 2
Changes of cortical DC-potentials induced by training: Auditory probe task. The displayed activation patterns are 'electrical top views' onto the unfolded surface of the head. Electrode positions are indicated by white dots, the color values result from interpolation including the four nearest electrodes for each pixel. (a) Initial DC-EEG in the 17 inexperienced subjects prior to first practice. Normalized data. (b) Activation changes (additional negative potential compared to the baseline (a)) after the first 20-minute practice. (c) Activation changes after 20.5 ± 7.9 days of practice (5 sessions). (d) Activation changes after 38.7 ± 11.6 days of practice (10 sessions). (e) group of 9 professional pianists (accumulated practice time = 19.4 ± 6.7 years) while performing the identical experimental paradigm. Normalized data. In (b), (c), and (d): Upper panel: Beginner group 1 ('map' group, n = 9), lower panel: Beginner group 2 ('no-map' group, n = 8). Subtractive data based on individual potential differences. (f) Color scale for normalized panels (a) and (e); (g) Color scale for subtractive panels (b) through (d).
Figure 3
Figure 3
Changes of cortical DC-potentials induced by training: Mute motor probe task For general legend, please cf. Fig. 2.
Figure 4
Figure 4
Average error incidences per note Average error incidences per note of a given melody, divided into pitch errors (note order only), timing errors and dynamics errors. The values of the 'map' group (n = 9) are displayed on the left, those of the 'no-map' group (n = 8) on the right. In each case, the left bar (light gray) dates from the first training session and the adjacent right one (dark gray) from the last session (session 11).
Figure 5
Figure 5
Changes of cortical activity induced by 10 sessions of training. Changes of cortical activity induced by 10 sessions of training. Shown are all inter-group-differences between the 'map' group and the 'no-map' group for an electrode selection (white dots) where the two groups differed significantly (P < 0.05). The electrode positions C3 (auditory probe task) and F10 (both task types) differed highly significant (P < 0.01) between the two groups. Topographic mapping results from two-dimensional 4-neighbors interpolation. RED: Areas where the training-induced changes are more pronounced in the 'map' group than in the 'no-map' group, with respect to cortical activation (i.e., more negative potentials). BLUE: Areas unaffected or inhibited due to the practice, in the 'map' group compared to the 'no-map' group.
Figure 6
Figure 6
Changes of cortical activity induced by 10 sessions of training. Activation changes for a right fronto-temporal selection of electrode sites (F8, F10, FT8, FT10, and T8). Tiled box plot. Green bars relate to the passive auditory task, red bars to the silent movement condition. Error bars not displayed; the differences within one condition are highly significant (P < 0.01).
Figure 7
Figure 7
Five-week schedule for the non-musicians. Schematic diagram of the training/testing sessions for the piano practice study. Chronological order of the sessions is top to bottom; order of sub-sessions within one day is left to right.
Figure 8
Figure 8
Two examples of the auditory targets generated by the training software, with musical notation. bpm: beats per minute – tempo is adjusted in order to constrain the duration of each stimulus to 3 sec. Level l = 1: Pitch range = 2 (C and D), beats = 3, additional quavers = 0, bpm = 60; Level l = 20: Pitch range = 5 (C through G, white keys), beats = 7, additional quavers = 2, bpm = 140.

References

    1. Haueisen J, Knösche TR. Involuntary motor activity in pianists evoked by music perception. J Cogn Neurosci. 2001;13:786–92. - PubMed
    1. Scheler G, Lotze M, Braitenberg V, Erb M, Braun C, Birbaumer N. Musician's brain: balance of sensorimotor economy and frontal creativity [abstract] Soc Neurosci Abstr. 2001;27:76.14.
    1. Bangert M, Parlitz D, Altenmüller E. Cortical audio-motor corepresentation in piano learning and expert piano performance [abstract] Soc Neurosci Abstr. 1998;24:658.
    1. Pascual-Leone A, Dang N, Cohen LG, Brasil-Neto JP, Cammarota A, Hallett M. Modulation of muscle responses evoked by transcranial magnetic stimulation during the acquisition of new fine motor skills. J Neurophysiol. 1995;74:1037–1045. - PubMed
    1. Classen J, Liepert J, Wise SP, Hallett M, Cohen LG. Rapid plasticity of human cortical movement representation induced by practice. J Neurophysiol. 1998;79:1117–1123. - PubMed

Publication types

MeSH terms