

Russian mortality trends for 1991-2001: analysis by cause and region
- PMID: 14576248
- PMCID: PMC259165
- DOI: 10.1136/bmj.327.7421.964
Russian mortality trends for 1991-2001: analysis by cause and region
Abstract
Objectives: To investigate trends in Russian mortality for 1991-2001 with particular reference to trends since the Russian economic crisis in 1998 and to geographical differences within Russia.
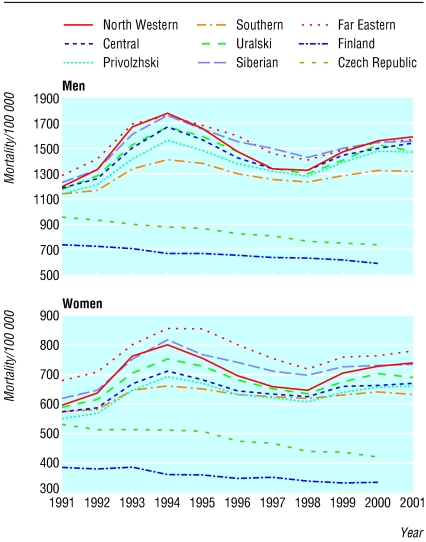
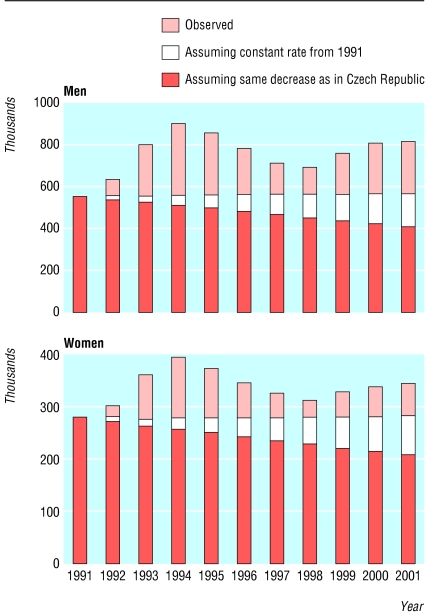
Design: Analysis of data obtained from the Russian State statistics committee for 1991-2001. All cause mortality was compared between seven federal regions. Comparison of cause specific rates was conducted for young (15-34 years) and middle aged adults (35-69 years). The number of Russian adults who died before age 70 in the period 1992-2001 and whose deaths were attributable to increased mortality was calculated.
Main outcome measures: Age, sex, and cause specific mortality standardised to the world population.
Results: Mortality increased substantially after the economic crisis in 1998, with life expectancy falling to 58.9 years among men and 71.8 years among women by 2001. Most of these fluctuations were due to changes in mortality from vascular disease and violent deaths (mainly suicides, homicides, unintentional poisoning, and traffic incidents) among young and middle aged adults. Trends were similar in all parts of Russia. An extra 2.5-3 million Russian adults died in middle age in the period 1992-2001 than would have been expected based on 1991 mortality.
Conclusions: Russian mortality was already high in 1991 and has increased further in the subsequent decade. Fluctuations in mortality seem to correlate strongly with underlying economic and societal factors. On an individual level, alcohol consumption is strongly implicated in being at least partially responsible for many of these trends.
Figures
References
-
- Leon DA, Chenet L, Shkolnikov VM, Zakharov S, Shapiro J, Rakhmanova G, et al. Huge variations in Russian mortality rates 1984-94: artefact, alcohol, or what? Lancet 1997;350: 383-8. - PubMed
-
- Shkolnikov V, McKee M, Leon DA. Changes in life expectancy in Russia in the mid-1990s. Lancet 2001;357: 917-21. - PubMed
-
- Mesle F. Mortality in Eastern Europe and the former Soviet Union: long term trends and recent upturns. Presented at IUSSP/MPIDR Workshop, June 19-21 2002. www.demogr.mpg.de/Papers/workshops/020619_paper27.pdf (accessed 23 July 2003).
Publication types
MeSH terms
LinkOut - more resources
Full Text Sources