. 2003 Nov 1;31(21):6290-305.
doi: 10.1093/nar/gkg793.

Functional dissection of the mouse tyrosinase locus control region identifies a new putative boundary activity

Affiliations

Functional dissection of the mouse tyrosinase locus control region identifies a new putative boundary activity

Patricia Giraldo et al. Nucleic Acids Res. .

Abstract

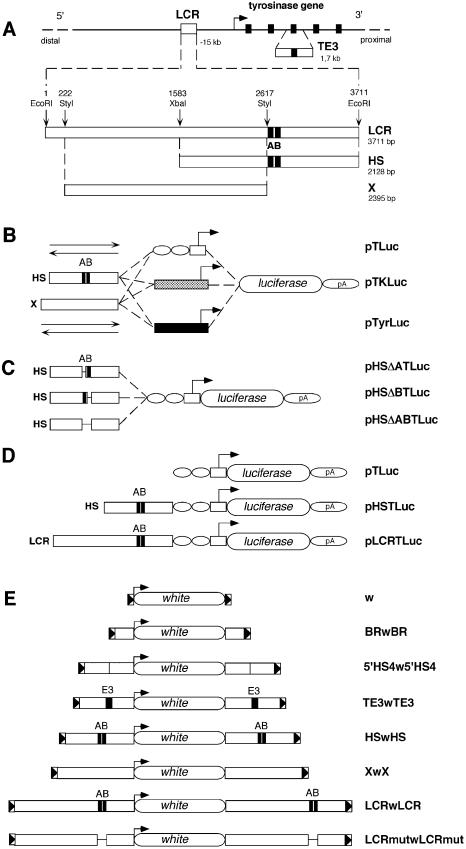
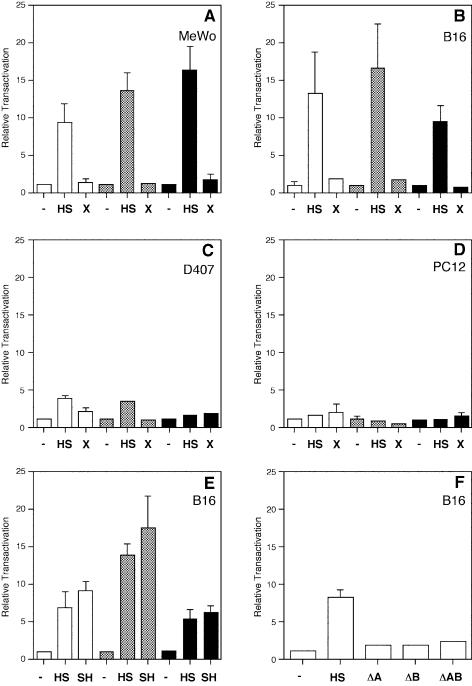
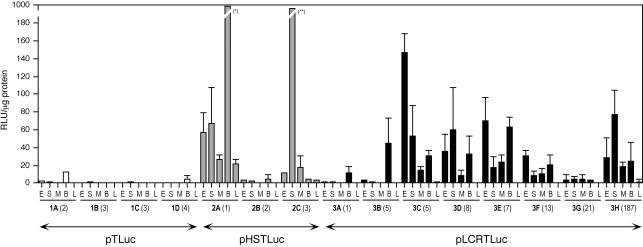
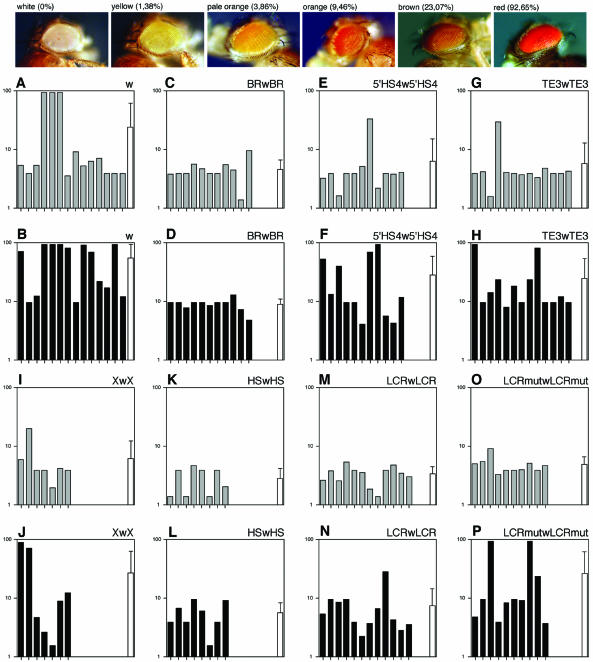
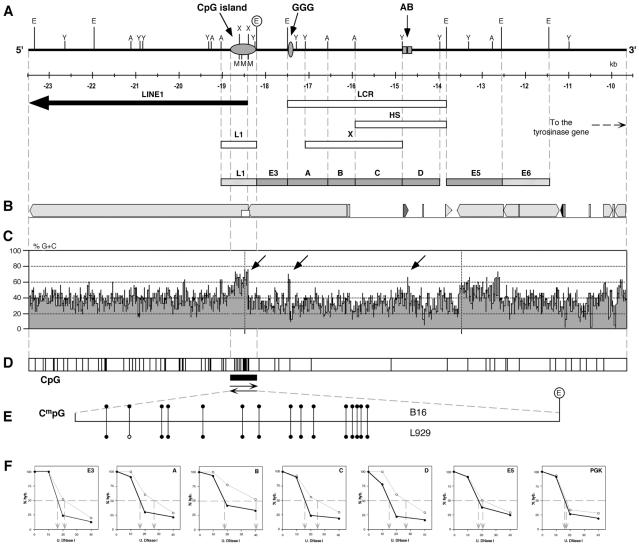
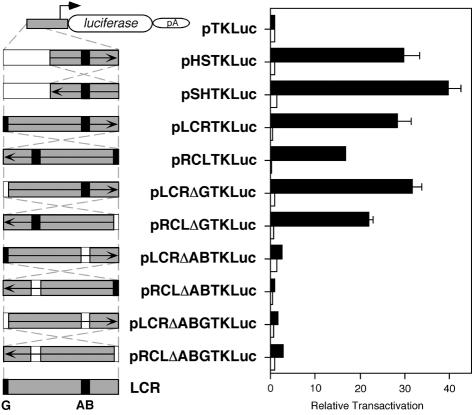
Locus control regions (LCRs) are complex high-order chromatin structures harbouring several regulatory elements, including enhancers and boundaries. We have analysed the mouse tyrosinase LCR functions, in vitro, in cell lines and, in vivo, in transgenic mice and flies. The LCR-core (2.1 kb), located at -15 kb and carrying a previously described tissue-specific DNase I hypersensitive site, operates as a transcriptional enhancer that efficiently transactivates heterologous promoters in a cell-specific orientation-independent manner. Furthermore, we have investigated the boundary activity of these sequences in transgenic animals and cells. In mice, the LCR fragment (3.7 kb) rescued a weakly expressed reference construct that displays position effects. In Drosophila, the LCR fragment and its core insulated the expression of a white minigene reporter construct from chromosomal position effects. In cells, sequences located 5' from the LCR-core displayed putative boundary activities. We have obtained genomic sequences surrounding the LCR fragment and found a LINE1 repeated element at 5'. In B16 melanoma and L929 fibroblast mouse cells, this element was found heavily methylated, supporting the existence of putative boundary elements that could prevent the spreading of condensed chromatin from the LINE1 sequences into the LCR fragment, experimentally shown to be in an open chromatin structure.


Figures

Figure 1
Figure 1
DNA constructs used for in vitro and in vivo assays. (A) Schematic view of the mouse tyrosinase locus and LCR sequences in mouse chromosome 7. A bent arrow indicates the transcription start site and direction of the mouse tyrosinase gene. Exons (5) are indicated as black rectangles. Not drawn to scale. A 1.7 kb fragment containing mouse tyrosinase exon 3 (TE3) and surrounding intronic sequences is shown below the mouse tyrosinase gene. The 3.7 kb EcoRI fragment containing the mouse tyrosinase LCR, located at –15 kb of the gene is shown below (3711 bp, EMBL Database X76647). Relative position of the 3.7 kb EcoRI DNA fragment with respect to the start of transcription of the tyrosinase gene (–15 kb) has been updated, according to the latest available mouse genome sequence information (see legend for Fig. 5), therefore correcting the position assigned to this LCR fragment in previous reports (14,17). The relative position of restriction enzymes used to subclone internal fragments is indicated along with their size in base pairs (bp). A and B black boxes, referred to previously as HS-1 and HS-2 (14), identify binding sequences for nuclear factors. (B) Three series of backbone plasmids are shown: pTLuc, containing a TATA box from the HSV-TK gene (white box), linked to two sites for the ubiquitous transcription factor Sp1 (white ovals); pTKLuc, containing the promoter of the HSV-TK gene (grey box); and pTyrLuc, carrying the mouse tyrosinase promoter (black box). Upstream of each promoter, the HS and X fragments were cloned in either direction (depicted as two arrows) resulting in the plasmids pHSTLuc, pSHTluc, pXTLuc, pXinvTLuc, pHSTKLuc, pSHTKLuc, pXTKLuc, pXinvTKLuc, pHSTyrLuc, pSHTyrLuc, pXTyrLuc and pXinvTyrLuc, respectively. (C) Plasmids used for functional analysis of deletion mutants within the HS fragment. (D) Constructs used to evaluate boundary activities of mouse tyrosinase LCR sequences in transgenic mice. All constructs shown in (B), (C) and (D) share the firefly luciferase reporter gene and the 3′ splice site and polyadenylation signal from the small t gene of the SV40 genome, indicated as pA. (E) DNA constructs used to evaluate boundary activities of mouse tyrosinase LCR sequences in transgenic flies. ‘w’ represents the reference construct [pCaSpeR3 (51)] containing a white minigene surrounded by 3′P and 5′P sequences from a P element (shown as triangles in a box). BRwBR carries the Su(Hw) BR of gypsy retrotransposon (52), 5′HS4w5′HS4 carries two copies of the 1.2 kb fragment containing the 5′HS4 of the chicken β-globin locus (36), TE3wTE3, HSwHS, XwX, LCRwLCR and LCRmutwLCRmut contain the corresponding mouse tyrosinase LCR DNA fragments.
Figure 2
Figure 2
Evaluation of the enhancer function of LCR sequences with homologous and heterologous promoters by transient transfection analysis in mammalian cells. Transient transfections of MeWo (A), B16 (B, E and F), D407 (C) and PC12 (D) cells, using HS, SH, X, HSΔA (ΔA), HSΔB (ΔB), HSΔAB (ΔAB) or none (–) LCR-derived fragments in combination with pTLuc (white bars), pTKLuc (grey bars) heterologous promoters and pTyrLuc (black bars) homologous promoter backbone plasmids (Fig. 1). Results are expressed as relative transactivation, arbitrarily assigning to backbone promoter-only plasmids (pTLuc, pTKLuc and pTyrLuc, respectively) the value of x1 and thereafter referring the activity of each construct to its corresponding promoter-only plasmid. In PC12 and D407 cells, tyrosinase promoter constructs produced luciferase reporter expression values close to background. Normalisation of the luciferase reporter values between different transfected constructs is achieved taking into account the activity of a co-transfected lacZ reporter plasmid and the number of pmols of experimental plasmid DNA used in each transfection. See Materials and Methods for plasmid sizes. Relative transactivations are mean values from triplicate experiments (±SD).
Figure 3
Figure 3
Analysis of boundary function of mouse tyrosinase LCR sequences in transgenic mice. Analysis of luciferase activity in transgenic mice generated with pTLuc (four lines, 1A to 1D, white bars), pHSTLuc (three lines, 2A to 2C, grey bars) and pLCRTLuc (eight lines, 3A to 3H, black bars), as shown in Figure 1D. Each bar represents the mean value of six adult individuals (±SD) in protein extracts from: eye (E), dorsal skin (S), skeletal muscle (M), brain (B) and liver (L). Transgene copy number is indicated, in parentheses, for each line. Luciferase activity is expressed as relative light units (RLU) per microgram of protein. Values that exceed this scale: (*) 979.52 ± 196.3 and (**) 223.04 ± 154.8 RLU/µg protein.
Figure 4
Figure 4
Analysis of boundary function of mouse tyrosinase LCR sequences in transgenic D.melanogaster. Protection from chromosomal position effects of mouse tyrosinase LCR sequences was carried out in transgenic flies using the white minigene assay. Top, fly heads, from reference white mutant stock along with representative transgenic individuals for yellow, pale orange, orange, brown and red eye colours are shown. Pictures are taken in air from anaesthetised animals. Percentage of red-pigment in eyes from each category, established by colorimetric methods (57), is indicated (100% = wild-type flies). The average amount of red-eye pigment within each line was estimated taking into account the percentage of individuals from a given colour observed within each line. Mean values of red-pigment content in eyes for each independent transgenic line are depicted graphically as single bars using a logarithm scale (y axis), because most of the perceived eye colour variability takes place below 10% of wild-type pigment level. Phenotypic evaluation of transgenic flies is shown in heterozygous (grey bars) and homozygous (black bars) individuals. A total of 86 transgenic fly lines are shown, grouped per construct and distributed as follows: 14 lines for ‘w’ (A and B); 11 for BRwBR (C and D); 11 for 5′HS4w5′HS4 (E and F); 13 for TE3wTE3 (G and H); 7 for XwX (I and J); 8 for HSwHS (K and L); 12 for LCRwLCR (M and N); and 10 for LCRmutwLCRmut (O and P). In addition, the overall means and standard deviations (SD) for all lines analysed within each construct are depicted as white bars and are also presented, without logarithm transformations, in Table 1.
Figure 5
Figure 5
Genomic structure and chromatin analysis of DNA sequences surrounding the mouse tyrosinase LCR. (A) Schematic view of the genomic DNA sequence (13 806 bp, GenBank AF364302) containing mouse tyrosinase LCR and neighbouring regions. All restriction enzyme sites for EcoRI (E), StyI (Y), XbaI (A), XhoI (X) and SmaI (M) are shown. Below, the relative distance from the transcription start of tyrosinase gene is indicated in kilobases (nucleotide positions according to Ensembl Project, Mouse Genome Sequencing Consortium; http://www.ensembl.org/Mus_musculus/geneview?gene=ENSMUSG00000004651; derived from BAC clone RP24-459G24 (EMBL accession number AC122517). These nucleotide coordinates have been used to update the position of the 3.7 kb EcoRI fragment, described previously at –12 kb (14,17), according to an original physical restriction site map made from overlapping bacteriophage clones (53). AF364302 is entirely contained within AC122517). A LINE1 element, located at 5′ end of the sequence, is indicated with a thick arrow. Relative position of DNA sub-fragments L1, LCR, HS and X, used for in vivo and in vitro expression analyses, are shown, along with a CG-rich sequence similar to a CpG island (grey horizontal oval), a short G-rich sequence (grey vertical oval) and A-B boxes (grey squares). E3, A, B, C, D and E5 DNA sub-fragments used as single-copy probes in DNase I sensitivity assays (grey boxes) and L1 and E6 repetitive DNA probes (striped boxes) are displayed below as eight adjacent boxes aligned with the sequence map. (B) Repeated elements identified in this sequence by Repeat Masker (A.F.A.Smit and P.Green, unpublished work; http://ftp.genome.washington.edu/cgi-bin/RepeatMasker/) and displayed using PIPMaker symbols (; http://bio.cse.psu.edu/pipmaker/). Light grey boxes correspond to LINE1-related repeated sequences. Smaller repeats from other families are shown. (C) Percentage of G + C plot along this sequence, using a window size of 30 nucleotides, generated with MacVector (Accelrys). DNA regions rich in G + C content that coincide with the GC-rich stretch of DNA similar to a CpG island, the G-rich and AB the sequences are indicated with arrows. (D) Linear map showing the occurrence of CpG dinucleotides (vertical bars) along this sequence. (E) Bisulphite genomic DNA sequencing of the 5′ CG-rich stretch of DNA similar to a CpG island in mouse melanoma B16 (above) and fibroblasts L929 (below) cells. The position of an EcoRI site, at 3′ end (within a circle), is provided for orientation purposes (AF364302, nucleotide position 5258). The relative positions of in vivo methylated CmpGs and unmethylated CpGs are shown as black and open circles, respectively. (F) Representative DNase I sensitivity analysis with E3, A, B, C, D, E5 (described above) and PGK probes. Nuclear chromatin samples obtained from melanoma B16 (black circles, thick line) and fibroblasts L929 (open circles, thin line) were digested with increasing amounts of DNase I. Thereafter, equivalent amounts of purified digested DNAs were spotted on nylon slot blots and hybridised with the indicated probe. Autoradiograms were quantitated by PhosphorImage analysis and expressed as a percentage of hybridisation signal detected in the undigested DNA sample (assigned to 100%). These percentages are depicted in these seven graphs as a function of DNase I concentration (U.). Fifty per cent hybridisation of samples is indicated with a dashed line. The estimated amount of DNase I required for 50% hybridisation is shown by descending dashed arrows. PGK probe is used as a control and stands for the mouse phosphoglycerate kinase gene promoter, obtained from plasmid pHM2 (GenBank X76683, nucleotides 6557–7064). DNase I general sensitivity assays were repeated three times with comparable results (in general, observed values varied between 5 and 20%, not shown).
Figure 6
Figure 6
Evaluation of boundary activities associated with tyrosinase LCR sequences by transient transfection analysis in mammalian cells. Transient transfection of backbone promoter-only plasmid pTKLuc, and its derivative constructs: pHSTKLuc, pSHTKLuc, pLCRTKLuc, pRCLTKLuc, pLCRΔGTKLuc, pRCLΔGTKLuc, pLCRΔABTKLuc, pRCLΔABTKLuc, pLCRΔABGTKLuc, pRCLΔABGTKLuc in B16 (black bars) and L929 (white bars) cells. Schemes of these plasmids (left) and the result of transfection in B16 and L929 cells (right) are shown. The AB enhancer-core and G-rich sequences are depicted as black boxes. Grey or white boxes correspond to the DNA fragments present or absent, respectively, in each construct. The arrow depicted inside each DNA fragment represent the 5′ to 3′ direction, with respect to the position of these sequences within the endogenous tyrosinase LCR and gene. Crossed and dashed lines indicate the inversion of the same DNA fragment in their corresponding experimental constructs. Results are expressed as relative transactivation, arbitrarily assigning to the backbone plasmid pTKLuc the value of x1 and thereafter referring the activity of each experimental construct to that value. Normalisation of the luciferase reporter values between different transfected constructs is achieved taking into account the activity of a co-transfected lacZ reporter plasmid and the number of pmols of experimental plasmid DNA used in each transfection. See Materials and Methods for plasmid sizes. Relative transactivations are mean values from triplicate experiments (±SD).

Similar articles

Cited by

References

    1. Dillon N. and Grosveld,F. (1994) Chromatin domains as potential units of eukaryotic gene function. Curr. Opin. Genet. Dev., 4, 260–264. - PubMed
    1. Elgin S.C. (1990) Chromatin structure and gene activity. Curr. Opin. Cell. Biol., 2, 437–445. - PubMed
    1. Bell A.C., West,A.G. and Felsenfeld,G. (2001) Insulators and boundaries: versatile regulatory elements in the eukaryotic genome. Science, 291, 447–450. - PubMed
    1. Laemmli U.K., Kas,E., Poljak,L. and Adachi,Y. (1992) Scaffold-associated regions: cis-acting determinants of chromatin structural loops and functional domains. Curr. Opin. Genet. Dev., 2, 275–285. - PubMed
    1. West A.G., Gaszner,M. and Felsenfeld,G. (2002) Insulators: many functions, many mechanisms. Genes Dev., 16, 271–288. - PubMed

Publication types

MeSH terms

Associated data