

Microarray analysis of gene expression during the cell cycle
- PMID: 14577836
- PMCID: PMC239863
- DOI: 10.1186/1475-9268-2-1
Microarray analysis of gene expression during the cell cycle
Abstract
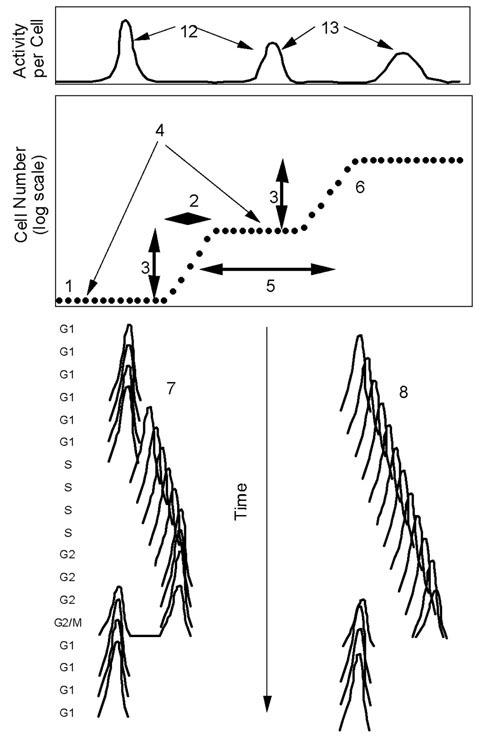
Microarrays have been applied to the determination of genome-wide expression patterns during the cell cycle of a number of different cells. Both eukaryotic and prokaryotic cells have been studied using whole-culture and selective synchronization methods. The published microarray data on yeast, mammalian, and bacterial cells have been uniformly interpreted as indicating that a large number of genes are expressed in a cell-cycle-dependent manner. These conclusions are reconsidered using explicit criteria for synchronization and precise criteria for identifying gene expression patterns during the cell cycle. The conclusions regarding cell-cycle-dependent gene expression based on microarray analysis are weakened by arguably problematic choices for synchronization methodology (e.g., whole-culture methods that do not synchronize cells) and questionable statistical rigor for identifying cell-cycle-dependent gene expression. Because of the uncertainties in synchrony methodology, as well as uncertainties in microarray analysis, one should be somewhat skeptical of claims that there are a large number of genes expressed in a cell-cycle-dependent manner.
Figures
References
-
- Cooper S. How the change from FLM to FACS affected our understanding of the G1 phase of the cell cycle. Cell Cycle. 2003;2:157–159. - PubMed
LinkOut - more resources
Full Text Sources
Other Literature Sources
Molecular Biology Databases
