Comparative Study
. 2003 Nov;163(5):2065-75.
doi: 10.1016/S0002-9440(10)63564-X.

PARC/CCL18 is a plasma CC chemokine with increased levels in childhood acute lymphoblastic leukemia

Affiliations
Comparative Study

PARC/CCL18 is a plasma CC chemokine with increased levels in childhood acute lymphoblastic leukemia

Sofie Struyf et al. Am J Pathol. 2003 Nov.

Abstract

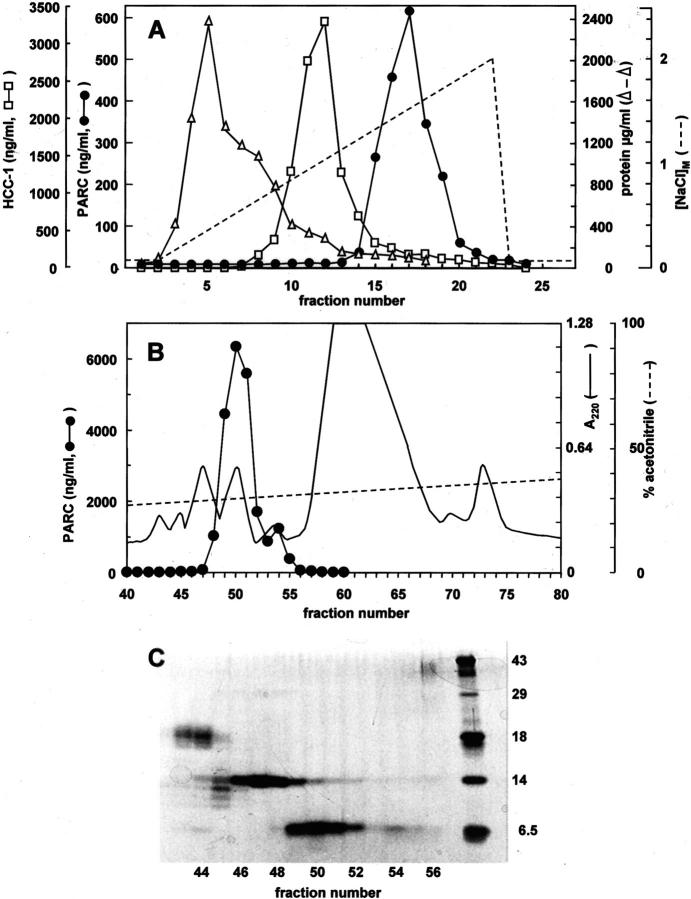
Chemokines play an important role in leukocyte mobilization, hematopoiesis, and angiogenesis. Tissue-specific expression of particular chemokines also influences tumor growth and metastasis. Here, the CC chemokine pulmonary and activation-regulated chemokine (PARC)/CCL18 was measured in pediatric patients with acute lymphoblastic leukemia (ALL) or acute myeloid leukemia (AML). Surprisingly, PARC immunoreactivity was consistently detected in plasma from healthy donors. After purification to homogeneity, the presence of intact PARC (1-69) and processed PARC (1-68) in normal human plasma was confirmed by sequence and mass spectrometry analysis. Furthermore, PARC serum levels were significantly increased in children with T-ALL and prepreB-ALL compared to control serum samples, whereas serum levels in AML and preB-ALL patients were not significantly different from controls. In contrast, the hemofiltrate CC chemokine-1 (HCC-1)/CCL14 was not found to be a biomarker in any of these patients' strata, whereas the cytokine interleukin-6 (IL-6) was significantly decreased in AML and prepreB-ALL. Stimulated leukocytic cell lines or lymphoblasts from patients produced IL-8/CXCL8 or macrophage inflammatory protein-1alpha (MIP-1alpha/CCL3) but not PARC, not even after IL-4 or IL-10 treatment. However, PARC was produced by superantigen or IL-4 stimulated monocytes co-cultured with lymphocytes or lymphoblastic cells. Serum PARC levels thus constitute a novel leukemia marker, possibly reflecting tumor/host cell interactions in the circulation.


Figures

Figure 1.
Figure 1.
Distribution of PARC and HCC-1 levels in normal human plasma. PARC and HCC-1 levels in plasma from 42 healthy blood donors were measured by their respective specific ELISAs. To illustrate the distribution of the chemokine levels, individual values are shown as well as box-plot representations. In the latter plot the horizontal bar in the box (between the lower line (=Q1) and the upper line (=Q3) 50% of the data are situated) depicts the median value. The whiskers delimit the range of the data inside the region defined by the lower limit (Q1–1.5(Q3-Q1)) and the upper limit (Q3 + 1.5(Q3-Q1)). Asterisks indicate outliers.
Figure 2.
Figure 2.
Purification of PARC immunoreactivity from normal human plasma. A pool (2400 ml) of six plasma donations was concentrated by adsorption to silicic acid and loaded onto a heparin-Sepharose column (A). Proteins were recovered from this column in a NaCl (0–2 mol/L) gradient (dashed line). All fractions were evaluated for protein content (open triangles) by the Coomassie blue binding assay and analyzed in the PARC (filled circles) and HCC-1 (open squares) ELISAs. After cation-exchange chromatography (not shown) PARC immunoreactivity was subjected to RP-HPLC (B). Proteins were eluted from the C8 column in an acetonitrile (0 to 80%) gradient (dashed line). Absorbance was monitored at 220 nm (solid line). PARC levels were determined in each HPLC fraction by a specific ELISA. HPLC fractions containing PARC immunoreactivity were analyzed by SDS-PAGE (C) under reducing conditions (fractions 43 to 56, 20 μl/lane). The proteins were visualized by silver staining. The right lane shows Mr markers (see Materials and Methods section).
Figure 3.
Figure 3.
Cytokine and chemokine serum levels in childhood acute leukemia. PARC, HCC-1, and IL-6 levels in serum were measured by specific ELISA (PARC and HCC-1) or bioassay (IL-6). In this study 13 AML, 11 T-ALL, 16 prepreB-ALL, and 11 preB-ALL patients (Table 1) ▶ , as well as a matched pediatric control group of patients from the same hospital were included. The horizontal bars indicate the median cytokine concentration for each group. Statistical analysis was performed using the Mann-Whitney test. Significance levels for differences in PARC or IL-6 serum concentration between a patient group and the control group are indicated at the top of the panels.
Figure 4.
Figure 4.
PARC is not produced by leukocytic cell lines. Cultures of the human monocytic leukemia cell line THP-1 (top panel) and the acute lymphoblastic leukemia cell line MT4 (bottom panel) were stimulated for 48 hours with measles virus (MV; 105.2 TCID50/ml), the dsRNA polyrI:rC (PIC; 10 μg/ml), LPS (50 μg/ml), PMA (10 ng/ml), ConA (10 μg/ml), IL-1 (100 U/ml), IFN-γ (20 ng/ml), IL-4 (30 ng/ml), IL-10 (100 ng/ml) or were left untreated (Co). The PARC (black histograms), IL-8 (open histograms), and MIP-1α (hatched histograms) concentrations were determined by specific ELISAs, and the mean ± SEM was calculated from at least two independent experiments. Significant differences from controls, determined by the Mann-Whitney test, are indicated by asterisks (**, P < 0.01).
Figure 5.
Figure 5.
Increased PARC levels in co-cultures of adherent monocytes with lymphocytes or lymphoblasts. Different cell concentrations (105 or 106 cells/ml) of freshly isolated lymphocytes (n = 7) or cultured T lymphoblastic cells (n = 6 for Sup-T1, n = 4 for MOLT-4) were added to cultures of adherent blood monocytes in the absence or presence of 300 ng/ml SEA or 30 ng/ml IL-4 to stimulate chemokine production. After 48 hours, cell supernatants were collected and analyzed for PARC content by a specific ELISA. Significant differences from control cultures (adherent monocytes alone in the presence of inducer), determined by the Mann-Whitney test, are indicated by asterisks (*, P < 0.05; **, P < 0.01; ***, P < 0.001). Freshly isolated lymphocytes or cultured T lymphoblastic cells alone failed to produce significant amounts of PARC, either unstimulated or after addition of IL-4 or SEA (not shown).

References

    1. Loetscher P, Moser B, Baggiolini M: Chemokines and their receptors in lymphocyte traffic and HIV infection. Adv Immunol 2000, 74:127-180 - PubMed
    1. Gerard C, Rollins BJ: Chemokines and disease. Nat Immunol 2001, 2:108-115 - PubMed
    1. Deuel TF, Keim PS, Farmer M, Heinrikson RL: Amino acid sequence of human platelet factor-4. Proc Natl Acad Sci USA 1977, 74:2256-2258 - PMC - PubMed
    1. Begg GS, Pepper DS, Chesterman CN, Morgan FJ: Complete covalent structure of human β-thromboglobulin. Biochemistry 1978, 17:1739-1744 - PubMed
    1. Brandt E, Petersen F, Ludwig A, Ehlert JE, Bock L, Flad HD: The β-thromboglobulins and platelet factor-4: blood platelet-derived CXC chemokines with divergent roles in early neutrophil regulation. J Leukoc Biol 2000, 67:471-478 - PubMed

Publication types

MeSH terms

LinkOut - more resources