. 2003 Nov 11;100(23):13134-9.
doi: 10.1073/pnas.2235812100. Epub 2003 Oct 24.

Saccharomyces cerevisiae phenotypes can be predicted by using constraint-based analysis of a genome-scale reconstructed metabolic network

Affiliations

Saccharomyces cerevisiae phenotypes can be predicted by using constraint-based analysis of a genome-scale reconstructed metabolic network

Iman Famili et al. Proc Natl Acad Sci U S A. .

Abstract

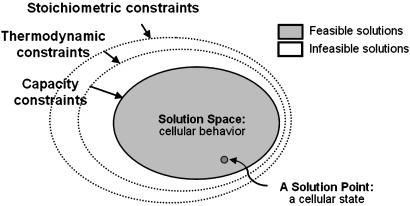
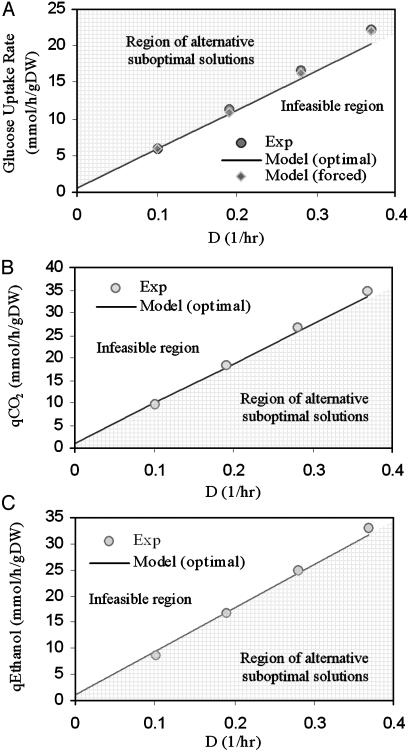
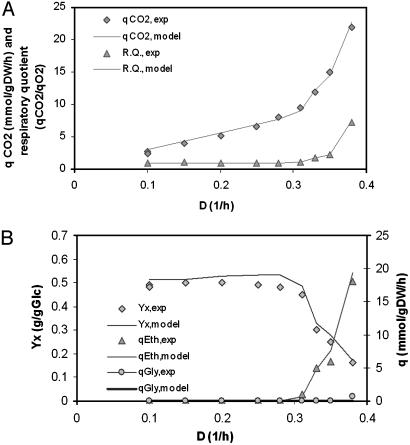
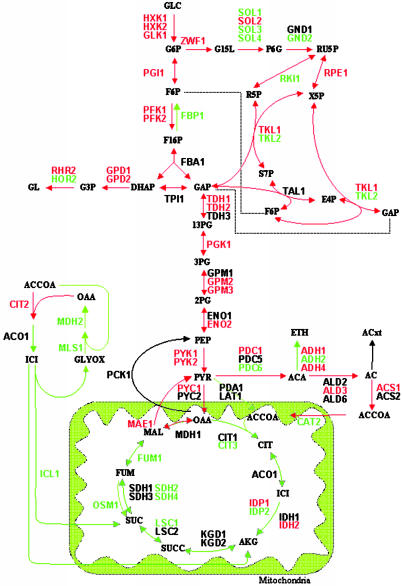
Full genome sequences of prokaryotic organisms have led to reconstruction of genome-scale metabolic networks and in silico computation of their integrated functions. The first genome-scale metabolic reconstruction for a eukaryotic cell, Saccharomyces cerevisiae, consisting of 1,175 metabolic reactions and 733 metabolites, has appeared. A constraint-based in silico analysis procedure was used to compute properties of the S. cerevisiae metabolic network. The computed number of ATP molecules produced per pair of electrons donated to the electron transport system (ETS) and energy-maintenance requirements were quantitatively in agreement with experimental results. Computed whole-cell functions of growth and metabolic by-product secretion in aerobic and anaerobic culture were consistent with experimental data, and thus mRNA expression profiles during metabolic shifts were computed. The computed consequences of gene knockouts on growth phenotypes were consistent with experimental observations. Thus, constraint-based analysis of a genome-scale metabolic network for the eukaryotic S. cerevisiae allows for computation of its integrated functions, producing in silico results that were consistent with observed phenotypic functions for approximately 70-80% of the conditions considered.


Figures

Fig. 1.
Fig. 1.
Constraint-based modeling approach. The governing physicochemical constraints, such as stoichiometric, thermodynamics, and reaction-rate capacity constraints, confine the possible phenotypic outcome of a cellular network (12). Physiologically feasible cellular states or the “solution points” lie within the constrained solution space and are indicated as “feasible solutions.” Any states excluded by the physicochemical constraints are “infeasible” and cannot be attained by the cell. Optimization tools such as linear programming then can be used to determine an optimal solution within the allowable range of cellular capabilities.
Fig. 2.
Fig. 2.
Anaerobic glucose-limited continuous culture of S. cerevisiae. (A) Utilization of glucose at varying dilution rates in anaerobic chemostat culture. The data point at the dilution rate of 0.0 is extrapolated from the experimental results. The shaded area (i.e., the infeasible region) contains a set of stoichiometric constraints that cannot be balanced simultaneously with growth demands. The model produces the optimal glucose uptake rate for a given growth rate on the line of optimal solution [Model (optimal)]. The imposition of additional constraints drives the solution toward a region in which more glucose is needed (i.e., region of alternative suboptimal solution). At the optimal solution, the in silico model does not secrete acetate. The maximum difference between the model and the experimental points is 9% at the highest dilution rate. When the model is forced to produce acetate at the experimental level [Model (forced)], the glucose uptake rate is increased and becomes closer to the experimental values (e.g., the 9% error is reduced to 1%). (B and C) Secretion rate of anaerobic by-products in chemostat culture. The highest difference between the model and the experimental data points is associated with glycerol production at the highest dilution rate for a value of 28% (Table 2). The ethanol secretion rate differences can be explained by a partial evaporation of ethanol in the experiments. Exp, experimental; q, secretion rate; D, dilution rate.
Fig. 3.
Fig. 3.
Aerobic glucose-limited continuous culture of S. cerevisiae. (A) Biomass yield (YX) and secretion rates of ethanol (Eth) and glycerol (Gly). The only data point not predicted by the model is the glycerol production at the highest dilution rate: D = 0.38 h-1.(B)CO2 secretion rate (qCO2) and respiratory quotient (R.Q.; qCO2/qO2) of the aerobic glucose-limited continuous culture of S. cerevisiae. Exp, experimental.
Fig. 4.
Fig. 4.
Gene expression and metabolic shift in anaerobic/aerobic glucose-limited continuous culture. The gene names in red and green have a higher and lower mRNA expression level, respectively, compared with the original condition. Red and green arrows correspond to an increase and decrease in flux activity, respectively. The changes in flux levels correlate qualitatively with changes in transcription levels in 78% of the investigated cases (35 of 45) and in 84% of the cases (37 of 44) during diauxic shift (Fig. 7, which is published as supporting information on the PNAS web site).

References

    1. Ideker, T., Galitski, T. & Hood, L. (2001) Annu. Rev. Genomics Hum. Genet. 2, 343-372. - PubMed
    1. Nielsen, J. & Olsson, L. (2002) FEMS Yeast Res. 2, 175-181. - PubMed
    1. Huang, S. (2002) Drug Discov. Today 7, S163-S169. - PubMed
    1. Strathern, J. N., Jones, E. W. & Broach, J. R. (1982) The Molecular Biology of the Yeast Saccharomyces: Metabolism and Gene Expression (Cold Spring Harbor Lab. Press, Plainview, NY).
    1. Cherry, J. M., Adler, C., Ball, C., Chervitz, S. A., Dwight, S. S., Hester, E. T., Jia, Y., Juvik, G., Roe, T., Schroeder, M., et al. (1998) Nucleic Acids Res. 26, 73-79. - PMC - PubMed

Publication types

LinkOut - more resources