. 2003 Nov;85(5):3074-83.
doi: 10.1016/S0006-3495(03)74726-2.

Separation of liquid phases in giant vesicles of ternary mixtures of phospholipids and cholesterol

Affiliations

Separation of liquid phases in giant vesicles of ternary mixtures of phospholipids and cholesterol

Sarah L Veatch et al. Biophys J. 2003 Nov.

Abstract

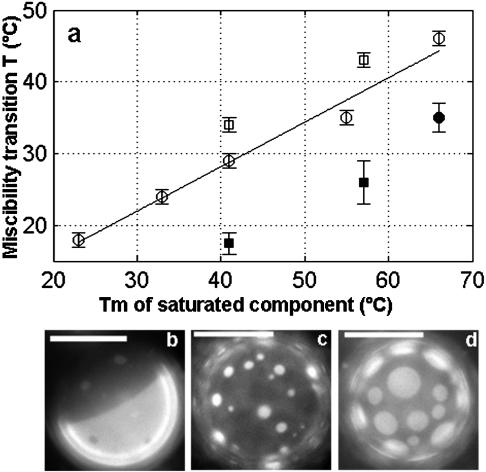
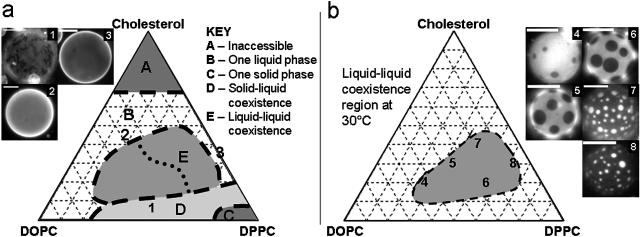
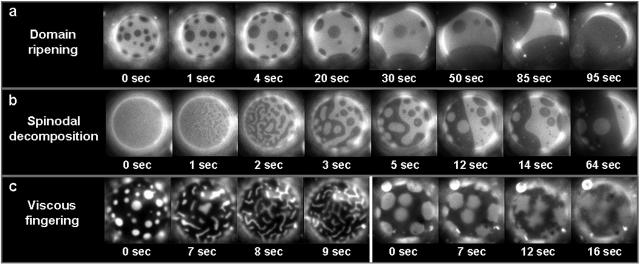
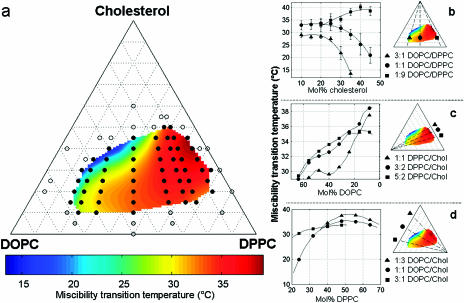
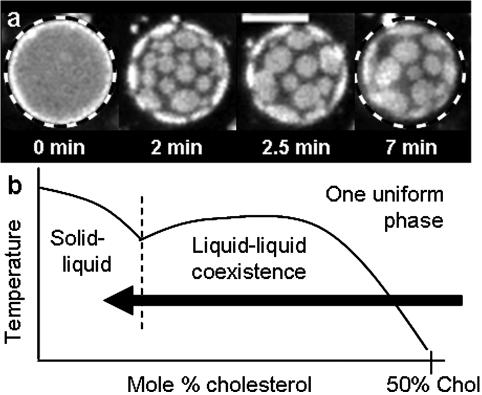
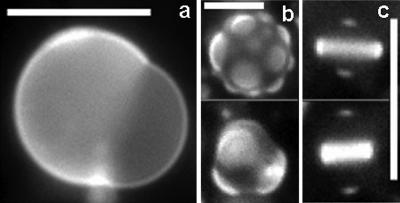
We use fluorescence microscopy to directly observe liquid phases in giant unilamellar vesicles. We find that a long list of ternary mixtures of high melting temperature (saturated) lipids, low melting temperature (usually unsaturated) lipids, and cholesterol produce liquid domains. For one model mixture in particular, DPPC/DOPC/Chol, we have mapped phase boundaries for the full ternary system. For this mixture we observe two coexisting liquid phases over a wide range of lipid composition and temperature, with one phase rich in the unsaturated lipid and the other rich in the saturated lipid and cholesterol. We find a simple relationship between chain melting temperature and miscibility transition temperature that holds for both phosphatidylcholine and sphingomyelin lipids. We experimentally cross miscibility boundaries both by changing temperature and by the depletion of cholesterol with beta-cyclodextrin. Liquid domains in vesicles exhibit interesting behavior: they collide and coalesce, can finger into stripes, and can bulge out of the vesicle. To date, we have not observed macroscopic separation of liquid phases in only binary lipid mixtures.


Figures

FIGURE 1
FIGURE 1
(a) Plot of miscibility transition temperature versus main chain transition temperature of the saturated component for various ternary mixtures shown in Table 1. Open circle, saturated PC/DOPC/Chol; Open square, pure SM/DOPC/Chol; filled circle, saturated PC/POPC/Chol; and filled square, pure SM/POPC/Chol. Miscibility transition temperatures are from 1:1:1 mixtures with the exception of POPC/DAPC/Chol, which was from a 2:2:1 ratio. Data for DMPC (Tm = 23°C) and di(15:0)PC (Tm = 33°C) were taken from Veatch and Keller (2002). Line is least squares fit of open circle points and has a functional form of Tmiscibility = 0.62 Tm + 3.4. (bd) Vesicle micrographs of 1:1:1 mixtures of (b) DOPC/SSM/Chol, (c) POPC/SSM/Chol, and (d) DCPC/DPPC/Chol. All images are taken below the miscibility transition temperature and scale bars are 20 μm.
FIGURE 2
FIGURE 2
(a) Sketch of the first phase separation observed in GUVs (if any) as temperature is lowered from a high temperature, one-phase region (see text). This is not a phase diagram since the boundaries are not at a particular temperature. Region E contains vesicles in which a liquid-liquid immiscibility transition is observed. (b) Observed phase diagram of micron-scale liquid immiscibility region in GUVs at 30°C. Compositions of vesicles in micrographs 1–8 are as follows: 1), 1:1 DOPC/DPPC + 5% Chol; 2), 2:1 DOPC/DPPC + 45% Chol; 3), DPPC + 40% Chol; 4), 2:1 DOPC/DPPC + 20% Chol; 5), 1:1 DOPC/DPPC + 30% Chol; 6), 1:2 DOPC/DPPC + 20% Chol; 7), 1:2 DOPC/DPPC + 40% Chol; and 8), 1:9 DOPC/DPPC + 30% Chol. All scale bars are 20μm. Vesicles 4–8 were imaged at 30 ± 1°C, and domains are not at equilibrium sizes.
FIGURE 3
FIGURE 3
Giant vesicles observed near the miscibility transition. (a) Domain ripening through time in a vesicle of 1:1 DOPC/DPPC + 25% Chol. Although the proportion of dark phase increases in one hemisphere, it is roughly constant in time over the entire vesicle. (b) Time sequence suggesting spinodal decomposition in a vesicle of 1:1 DOPC/DPPC + 35% Chol. (c) Viscous fingering in a vesicle of 1:9 DOPC/DPPC + 25% Chol (left series) and 1:1 DOPC/DMPC + 25% Chol (right series) as temperature is raised through the miscibility transition. The uniform stripe-widths shown at the left are unique to this vesicle composition. All vesicles are roughly 30 μm in diameter.
FIGURE 4
FIGURE 4
Effect of lipid composition on liquid immiscibility transition temperatures in GUVs of DOPC, DPPC, and Chol. (a) Open symbols denote that no transition was observed down to 10°C, black symbols denote that miscibility transitions were observed and measured, and gray symbols denote that solid phases were observed. The colored surface is an interpolated fit of the black points. Errors are generally ±1°C. (bd) Two-dimensional cuts through the miscibility phase boundary with constant ratios of (b) DOPC/DPPC, (c) DPPC/Chol, and (d) DOPC/Chol. Actual data points are shown in b, and error bars are standard deviations of the temperatures measured. Curves shown in c and d are cuts through the extrapolated surface, and points do not necessarily represent compositions where temperatures were measured. Solid lines are drawn to guide the eye and are not explicit fits to any theoretical prediction.
FIGURE 5
FIGURE 5
(a) Time series of 1:1 DOPC/DPPC + 60% Chol vesicle imaged after the addition of β-cyclodextrin (roughly 5 mM) at constant room temperature. Fixed diameter dashed circles demonstrate that the surface area of the vesicle has decreased. Scale bar is 20 μm. (b) Sketch of miscibility phase boundary for 1:1 DOPC/DPPC vesicles with varying amounts of cholesterol.
FIGURE 6
FIGURE 6
Vesicle micrographs of GUVs with bulged domains below their miscibility transition temperature. Vesicles are composed of (a) 1:2 DOPC/DPPC + 35% Chol, (b) 1:1 DOPC/DMPC + 30% Chol, and (c) 1:4 DOPC/DPPC + 25% Chol. All scale bars are 20 μm.

Similar articles

Cited by

References

    1. Alecio, M. R., D. E. Golan, W. R. Veatch, and R. R. Rando. 1982. Use of a fluorescent cholesterol derivative to measure lateral mobility of cholesterol in membranes. Proc. Natl. Acad. Sci. USA. 79:5171–5174. - PMC - PubMed
    1. Anderson, R. G., and K. Jacobson. 2002. A role for lipid shells in targeting proteins to caveolae, rafts, and other lipid domains. Science. 296:1821–1825. - PubMed
    1. Angelova, M. I., S. Soleau, P. Meleard, J. F. Faucon, and P. Bothorel. 1992. Preparation of giant vesicles by external AC electric fields. Prog. Colloid Polym. Sci. 89:127–131.
    1. Arneodo, A., Y. Couder, G. Grasseau, V. Hakim, and M. Rabaud. 1990. Pattern growth: from smooth interfaces to fractal structures. In Nonlinear Evolution of Spatio-Temporal Structures in Dissipative Continuous Systems. F. H. Busse and L. Kramer, editors. Plenum Press, New York. 481.
    1. Bacha, D., and E. Wachtel. 2003. Phospholipid/cholesterol model membranes: formation of cholesterol crystallites. Biochim. Biophys. Acta. 1610:187–197. - PubMed

Publication types