

Characterization of DNA/lipid complexes by fluorescence resonance energy transfer
- PMID: 14581211
- PMCID: PMC1303587
- DOI: 10.1016/S0006-3495(03)74729-8
Characterization of DNA/lipid complexes by fluorescence resonance energy transfer
Abstract
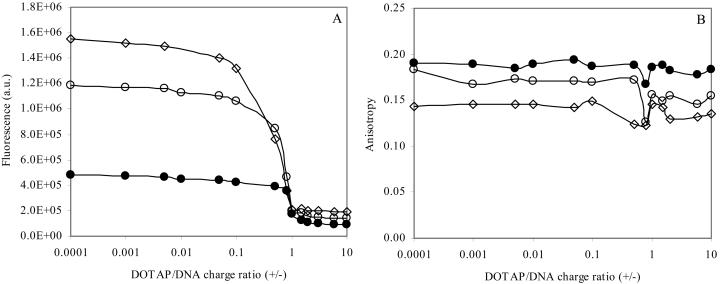
Fluorescence resonance energy transfer (FRET) is a potential method for the characterization of DNA-cationic lipid complexes (lipoplexes). In this work, we used FRET models assuming a multilamellar lipoplex arrangement. The application of these models allows the determination of the distance between the fluorescent intercalator on the DNA and a membrane dye on the lipid, and/or the evaluation of encapsulation efficiencies of this liposomal vehicle. The experiments were carried out in 1,2-dioleoyl-3-trimethylammonium-propane/pUC19 complexes with different charge ratios. We used 2-(3-(diphenylhexatrienyl)propanoyl)-1-hexadecanoyl-sn-glycero-3-phosphocholine (DPH-PC) and 2-(4,4-difluoro-5-octyl-4-bora-3a,4a-diaza-s-indacene-3-pentanoyl)-1-hexadecanoyl-sn-glycero-3-phosphocholine (BODIPY-PC) as membrane dyes, and ethidium bromide (EtBr) and BOBO-1 as DNA intercalators. In cationic complexes (charge ratios (+/-) >or= 2), we verified that BOBO-1 remains bound to DNA, and FRET occurs to the membrane dye. This was also confirmed by anisotropy and lifetime measurements. In complexes with all DNA bound to the lipid (charge ratio (+/-) = 4), we determined 27 A as the distance between the donor and acceptor planes (half the repeat distance for a multilamellar arrangement). In complexes with DNA unbound to the lipids (charge ratio (+/-) = 0.5 and 2), we calculated the encapsulation efficiencies. The presented FRET methodology is, to our knowledge, the first procedure allowing quantification of lipid-DNA contact.
Figures


Similar articles
-
Liposome complexation efficiency monitored by FRET: effect of charge ratio, helper lipid and plasmid size.Eur Biophys J. 2007 Jul;36(6):609-20. doi: 10.1007/s00249-007-0130-x. Epub 2007 Jan 30. Eur Biophys J. 2007. PMID: 17262222
-
Photophysical behavior of a dimeric cyanine dye (BOBO-1) within cationic liposomes.Photochem Photobiol. 2005 Nov-Dec;81(6):1450-9. doi: 10.1562/2005-03-16-RA-464. Photochem Photobiol. 2005. PMID: 16029081
-
Fluorescence resonance energy transfer-based analysis of lipoplexes.Methods Mol Biol. 2010;606:393-8. doi: 10.1007/978-1-60761-447-0_27. Methods Mol Biol. 2010. PMID: 20013411
-
Fluorescence methods for lipoplex characterization.Biochim Biophys Acta. 2011 Nov;1808(11):2694-705. doi: 10.1016/j.bbamem.2011.07.020. Epub 2011 Jul 29. Biochim Biophys Acta. 2011. PMID: 21819961 Review.
-
Distance determination in protein-DNA complexes using fluorescence resonance energy transfer.Methods Mol Biol. 2006;335:243-55. doi: 10.1385/1-59745-069-3:243. Methods Mol Biol. 2006. PMID: 16785632 Review.
Cited by
-
Cationic liposome/DNA complexes: from structure to interactions with cellular membranes.Eur Biophys J. 2012 Oct;41(10):815-29. doi: 10.1007/s00249-012-0830-8. Epub 2012 Jun 19. Eur Biophys J. 2012. PMID: 22710765 Review.
-
Looking Back, Moving Forward: Lipid Nanoparticles as a Promising Frontier in Gene Delivery.ACS Pharmacol Transl Sci. 2023 Oct 24;6(11):1561-1573. doi: 10.1021/acsptsci.3c00185. eCollection 2023 Nov 10. ACS Pharmacol Transl Sci. 2023. PMID: 37974625 Free PMC article. Review.
-
Interaction kinetics of peptide lipids-mediated gene delivery.J Nanobiotechnology. 2020 Oct 17;18(1):144. doi: 10.1186/s12951-020-00707-1. J Nanobiotechnology. 2020. PMID: 33069258 Free PMC article.
-
Effect of ionic strength and presence of serum on lipoplexes structure monitorized by FRET.BMC Biotechnol. 2008 Feb 26;8:20. doi: 10.1186/1472-6750-8-20. BMC Biotechnol. 2008. PMID: 18302788 Free PMC article.
-
Liposome complexation efficiency monitored by FRET: effect of charge ratio, helper lipid and plasmid size.Eur Biophys J. 2007 Jul;36(6):609-20. doi: 10.1007/s00249-007-0130-x. Epub 2007 Jan 30. Eur Biophys J. 2007. PMID: 17262222
References
-
- Battersby, B. J., R. Grimm, S. Huebner, and G. Cevc. 1998. Evidence for three-dimensional interlayer correlations in cationic lipid-DNA complexes as observed by cryo-electron microscopy. Biochim. Biophys. Acta. 1372:379–383. - PubMed
-
- Berberan-Santos, M. N., and M. J. E. Prieto. 1987. Energy transfer in spherical geometry. Application to micelles. J. Chem. Soc. Trans. 83:1391–1409.
-
- Caracciolo, G., R. Caminiti, D. Pozzi, M. Friello, F. Boffi, and A. C. Castellano. 2002. Self-assembly of cationic liposomes-DNA complexes: a structural and thermodynamic study by EDXD. Chem. Phys. Lett. 351:222–228.
Publication types
MeSH terms
Substances
LinkOut - more resources
Full Text Sources
