

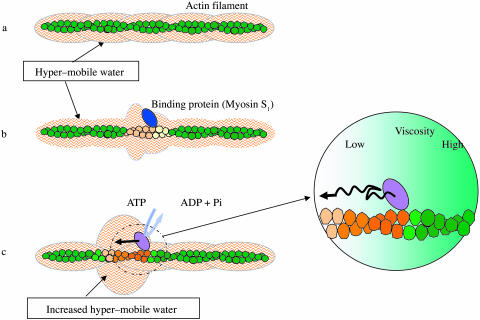
Hyper-mobile water is induced around actin filaments
- PMID: 14581215
- PMCID: PMC1303591
- DOI: 10.1016/S0006-3495(03)74733-X
Hyper-mobile water is induced around actin filaments
Abstract
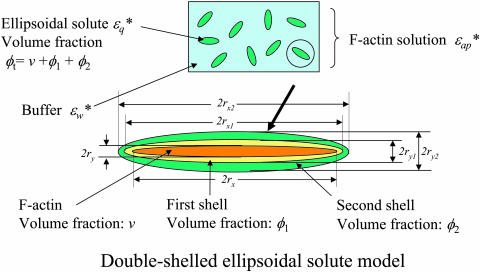
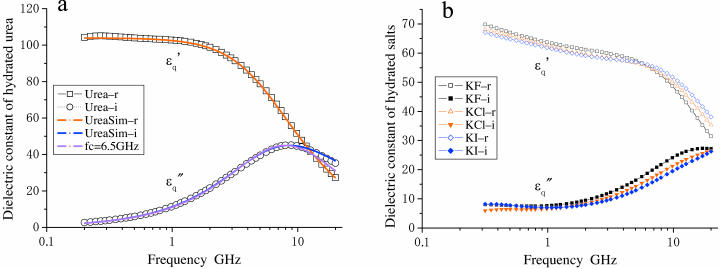
When introduced into water, some molecules and ions (solutes) enforce the hydrogen-bonded network of neighboring water molecules that are thus restrained from thermal motions and are less mobile than those in the bulk phase (structure-making or positive hydration effect), and other solutes cause the opposite effect (structure-breaking or negative hydration effect). Using a method of microwave dielectric spectroscopy recently developed to measure the rotational mobility (dielectric relaxation frequency) of water hydrating proteins and the volume of hydration shells, the hydration of actin filament (F-actin) has been studied. The results indicate that F-actin exhibits both the structure-making and structure-breaking effects. Thus, apart from the water molecules with lowered rotational mobility that make up a typical hydration shell, there are other water molecules around the F-actin which have a much higher mobility than that of bulk water. No such dual hydration has been observed for myoglobin studied as the representative example of globular proteins which all showed qualitatively similar dielectric spectra. The volume fraction of the mobilized (hyper-mobile) water is roughly equal to that of the restrained water, which is two-thirds of the molecular volume of G-actin in size. The dielectric spectra of aqueous solutions of urea and potassium-halide salts have also been studied. The results suggest that urea and I(-) induce the hyper-mobile states of water, which is consistent with their well-known structure-breaking effect. The molecular surface of actin is rich in negative charges, which along with its filamentous structure provides a structural basis for the induction of a hyper-mobile state of water. A possible implication of the findings of the present study is discussed in relation to the chemomechanical energy transduction through interaction with myosin in the presence of ATP.
Figures
References
-
- Bellissent-Funel, M.-C. 1999. Hydration Process in Biology, NATO Science Series, Series A, Vol. 305. IOS Press, Amsterdam, The Netherlands.
-
- Bloomfield, V. 2002. Survey of biomolecular hydrodynamics. In Separations, and Hydrodynamics. J. Correia, editor. Biophysical Society, Bethesda, MD. http://www.biophysics.org/btol/separat.html.
-
- Bryant, R. G. 1996. The dynamics of water-protein interactions. Annu. Rev. Biophys. Biomol. Struct. 25:29–53. - PubMed
-
- Buchner, R., J. Barthel, and J. Stauber. 1999. The dielectric relaxation of water between 0°C, and 35°C. Chem. Phys. Lett. 306:57–63.
Publication types
MeSH terms
Substances
LinkOut - more resources
Full Text Sources
