. 2003 Nov;85(5):3286-93.
doi: 10.1016/S0006-3495(03)74747-X.

Pathway shifts and thermal softening in temperature-coupled forced unfolding of spectrin domains

Affiliations

Pathway shifts and thermal softening in temperature-coupled forced unfolding of spectrin domains

Richard Law et al. Biophys J. 2003 Nov.

Abstract

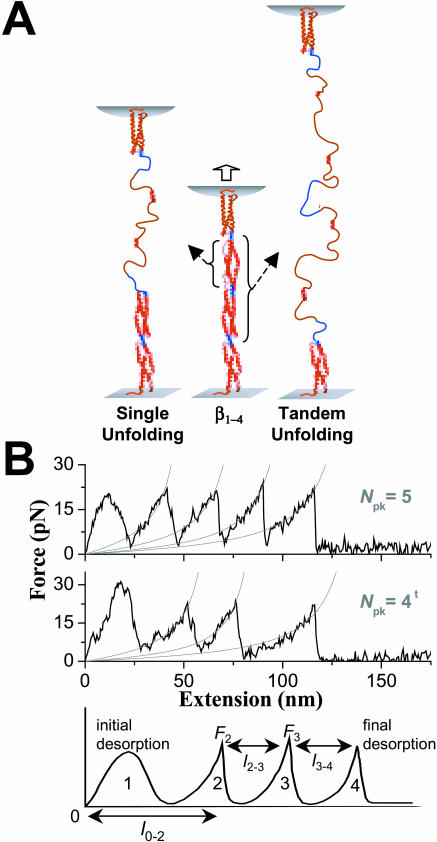
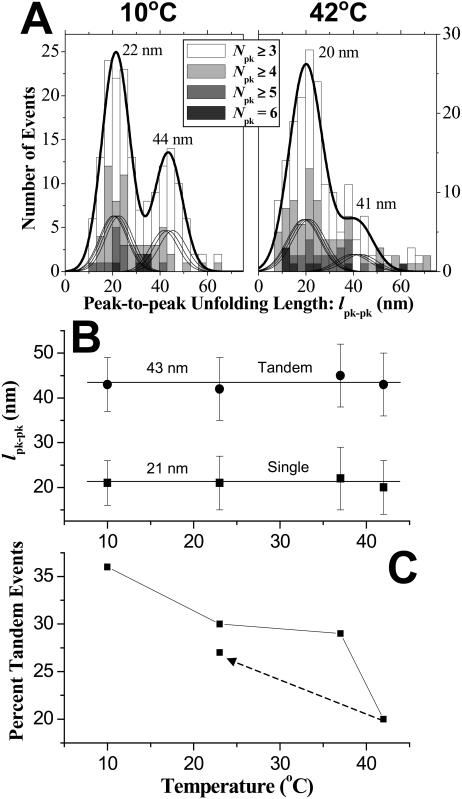
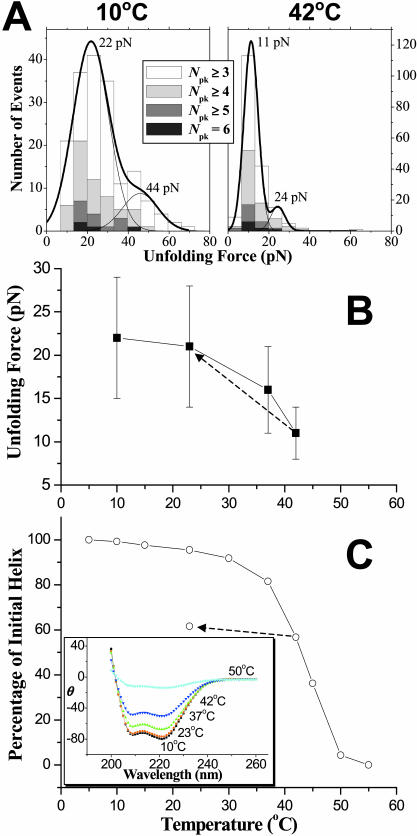
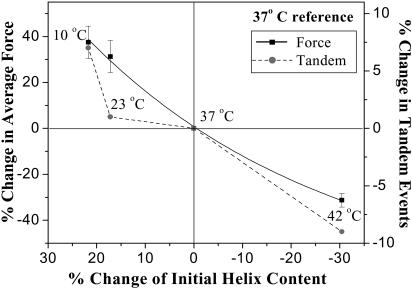
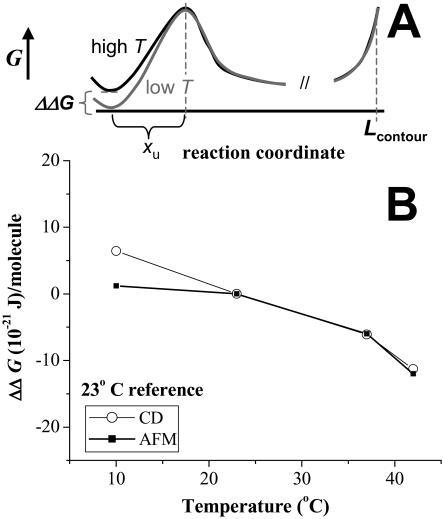
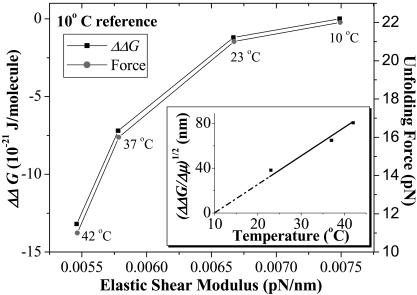
Pathways of unfolding a protein depend in principle on the perturbation-whether it is temperature, denaturant, or even forced extension. Widely-shared, helical-bundle spectrin repeats are known to melt at temperatures as low as 40-45 degrees C and are also known to unfold via multiple pathways as single molecules in atomic force microscopy. Given the varied roles of spectrin family proteins in cell deformability, we sought to determine the coupled effects of temperature on forced unfolding. Bimodal distributions of unfolding intervals are seen at all temperatures for the four-repeat beta(1-4) spectrin-an alpha-actinin homolog. The major unfolding length corresponds to unfolding of a single repeat, and a minor peak at twice the length corresponds to tandem repeats. Increasing temperature shows fewer tandem events but has no effect on unfolding intervals. As T approaches T(m), however, mean unfolding forces in atomic force microscopy also decrease; and circular dichroism studies demonstrate a nearly proportional decrease of helical content in solution. The results imply a thermal softening of a helical linker between repeats which otherwise propagates a helix-to-coil transition to adjacent repeats. In sum, structural changes with temperature correlate with both single-molecule unfolding forces and shifts in unfolding pathways.


Figures

FIGURE 1
FIGURE 1
Forced extension schematic and AFM force spectrograms for β1–4 spectrin. (A) Unfolding of either single or tandem repeats. Blue linker regions are shown between the four red repeats. (B) Force-extension curves show the number of peaks (Npk) for both single and tandem unfolding processes. Curves with the latter are characterized by at least one peak-to-peak length that is twice those of single repeat unfolding events, and such curves are denoted with a superscript t on the Npk. Force peaks after the first are less symmetric and are fit, for simplicity, by the WLC model F(x) = (kBT/p) [(x/LC) + 0.25/(1 − x/LC)2 − 0.25] where x is chain extension and LC is the contour length appropriate to the number of unfolded repeats. The fitted persistence length, p, that characterizes the minimal flexible length of an unfolded domain, averaged 0.5 nm at 23°C, consistent with prior reports (Law et al., 2003; Rief et al., 1999). The last spectrogram illustrates how a four-peak spectrogram is analyzed and how l0–2 is measured. Force spectrograms with three or more peaks correspond to unfolding, but spectrograms with 0–2 peaks accounted for most of the data.
FIGURE 2
FIGURE 2
Temperature effects on unfolding length and percentage of tandem events. (A) Peak-to-peak unfolding length from ensembles of extension curves at 10°C and 42°C. The unfolding distributions for both temperatures were fitted with sums of Gaussians that reflect proportional contour lengths for single repeats. The minor peaks were likewise fitted but with proportional contour lengths of tandem repeats. The overall sum of all the Gaussians is indicated by the heavy black line. (B) A factor of nearly two between the major (single repeat) and minor (tandem repeats) peaks is apparent for temperatures from 10 to 42°C. (C) The percentage of tandem repeat unfolding events decreases with temperature. The dotted arrow indicates that in cooling from 42°C to 23°C, the percentage of tandem repeat unfolding events returns to within 90% of the initial value.
FIGURE 3
FIGURE 3
Nonlinear temperature dependence of both unfolding force and percentage of initial helix for β1–4 spectrin. (A) Force distributions from ensembles of extension curves at 10°C and 42°C. Force distributions were fitted with two Gaussians. The major Gaussian indicates the force to unfold a single protein chain and the minor Gaussian, at about twice the force, represents unfolding of two independent chains. (B) Unfolding forces of single molecules show that the average unfolding forces decrease by half from 10°C (22 pN) to 42°C (11 pN). The dotted arrow indicates that when the sample was cooled to 23°C from 42°C, the unfolding force returns to 21 pN. (C) Percentage of initial helix versus temperature from circular dichroism. At 42°C, the percentage of initial helix is 56%. The dotted arrow indicates the effect of cooling the sample from 42°C to 23°C: the percentage of initial helix increases <10%. The unfolding forces and percentage of initial helix, nonetheless, follow the same nonlinear decrease with temperature. The inset shows CD spectra up to 55°C, where β1–4 is completely unfolded.
FIGURE 4
FIGURE 4
Percentage change in both mean unfolding force and tandem events versus percentage change in helix content using 37°C as the reference temperature. The weakly nonlinear relationship for change in force is fitted with a second-order polynomial function.
FIGURE 5
FIGURE 5
Energetic comparison between AFM and CD. (A) Low and high temperature free energy landscapes for protein unfolding, with the unfolded state free energy used as a reference. (B) The temperature-dependent change in folding-unfolding free energy difference (ΔΔG) for both CD and AFM. 23°C is used as reference. Both calculations clearly show decreases in ΔΔG with temperature, emphasizing the increased tendency to unfold at higher temperature.
FIGURE 6
FIGURE 6
Nonlinear correlations between the red cell's shear elastic modulus and both ΔΔG and unfolding force, F. The elastic modulus, μ, data is extracted from Waugh and Evans (1979) and plotted against ΔΔG and unfolding forces from these AFM results. The reference temperature for ΔΔG is 10°C. Each data point is labeled with the temperature at which the data was extracted. The inset shows that, with increasing temperature, the relative length (ΔΔGμ)1/2 also increases, representing increased unfolding of spectrin repeats in the heated cell membrane.

References

    1. Altmann, S., R. Grunberg, P. Lenne, J. Ylanne, A. Raae, K. Herbert, M. Saraste, M. Nilges, and J. Horber. 2002. Pathways and intermediates in forced unfolding of spectrin repeats. Structure. 10:1085–1096. - PubMed
    1. Bell, G. I. 1978. Models for the specific adhesion of cells to cells. Science. 200:618–627. - PubMed
    1. Best, R., S. Fowler, J. Toca-Herrera, and J. Clarke. 2002. A simple method for probing the mechanical unfolding pathway of proteins in detail. Proc. Natl. Acad. Sci. USA. 99:12143–12148. - PMC - PubMed
    1. Cantor, C. R., and P. R. Schimmel. 1980. Biophysical Chemistry, Part III—The Behavior of Biological Macromolecules. W.H. Freeman and Co., New York.
    1. Carl, P., C. H. Kwok, G. Manderson, D. W. Speicher, and D. E. Discher. 2001. Forced unfolding modulated by disulfide bonds in the Ig domains of a cell adhesion molecule. Proc. Natl. Acad. Sci. USA. 98:1565–1570. - PMC - PubMed

Publication types

LinkOut - more resources