. 2003 Oct 27;163(2):397-408.
doi: 10.1083/jcb.200304154.

Integrin-linked kinase is required for laminin-2-induced oligodendrocyte cell spreading and CNS myelination

Affiliations

Integrin-linked kinase is required for laminin-2-induced oligodendrocyte cell spreading and CNS myelination

Soo Jin Chun et al. J Cell Biol. .

Erratum in

  • J Cell Biol. 2006 Jul 17;174(2):315

Abstract

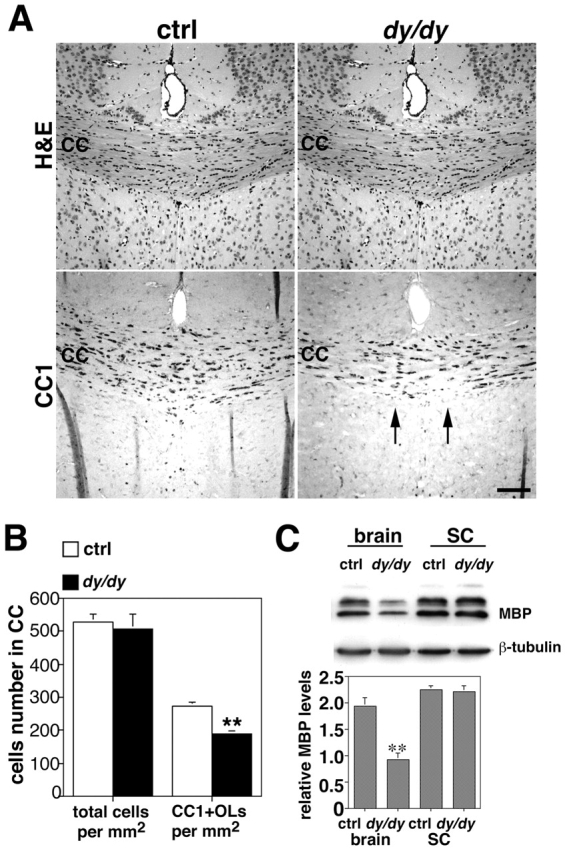
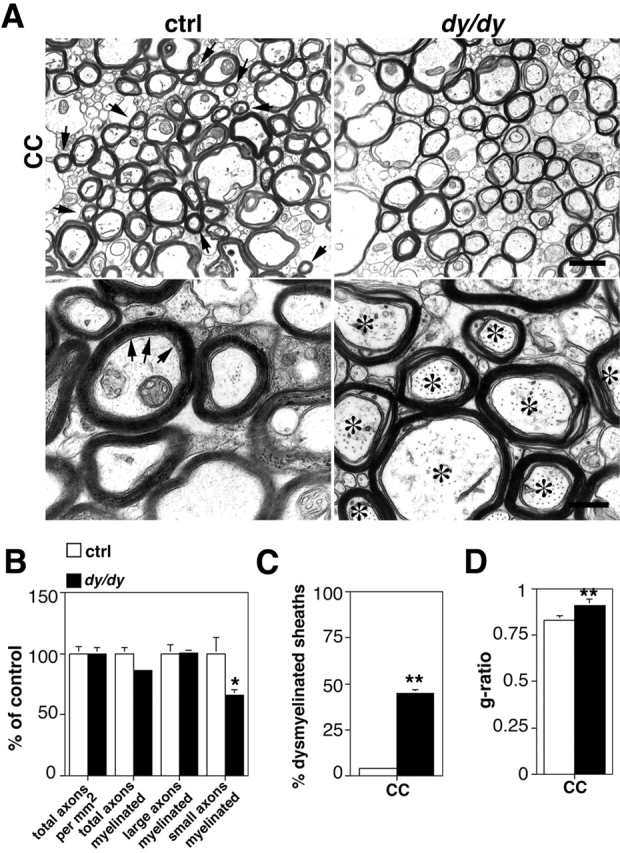
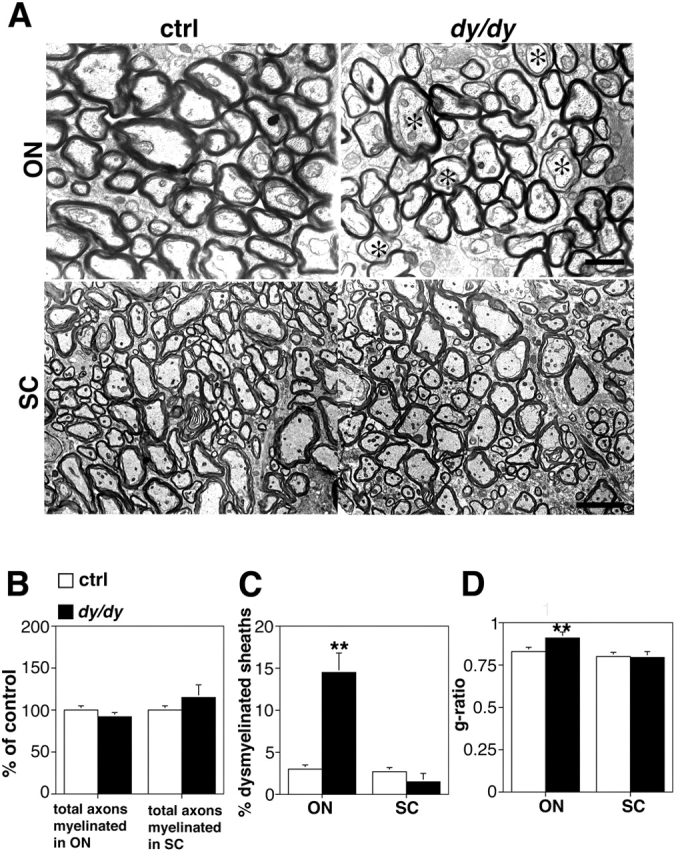
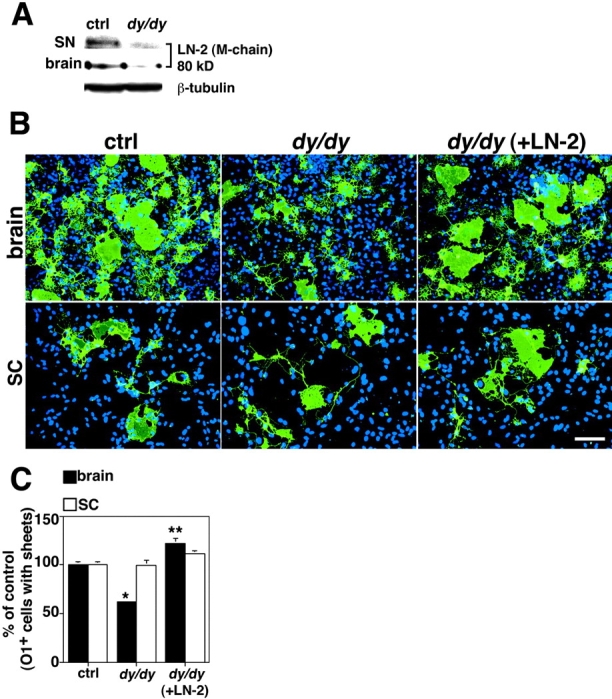
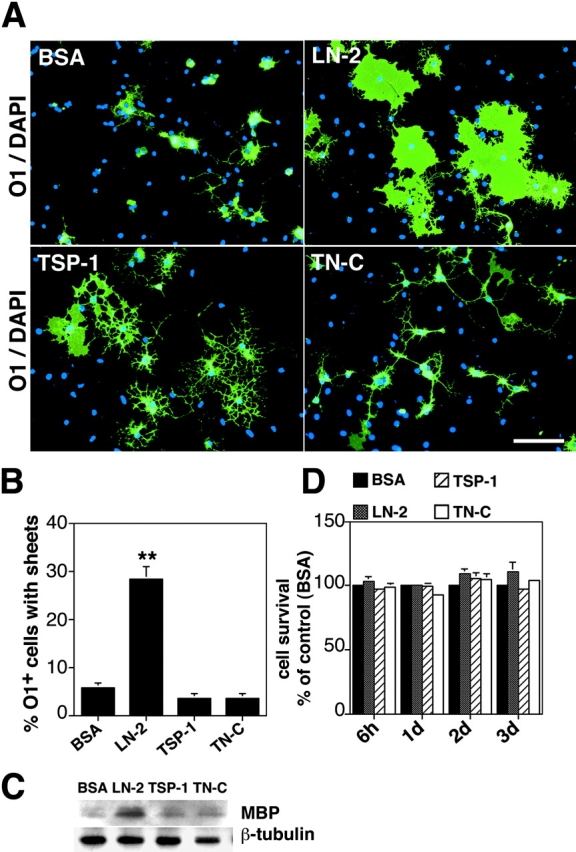
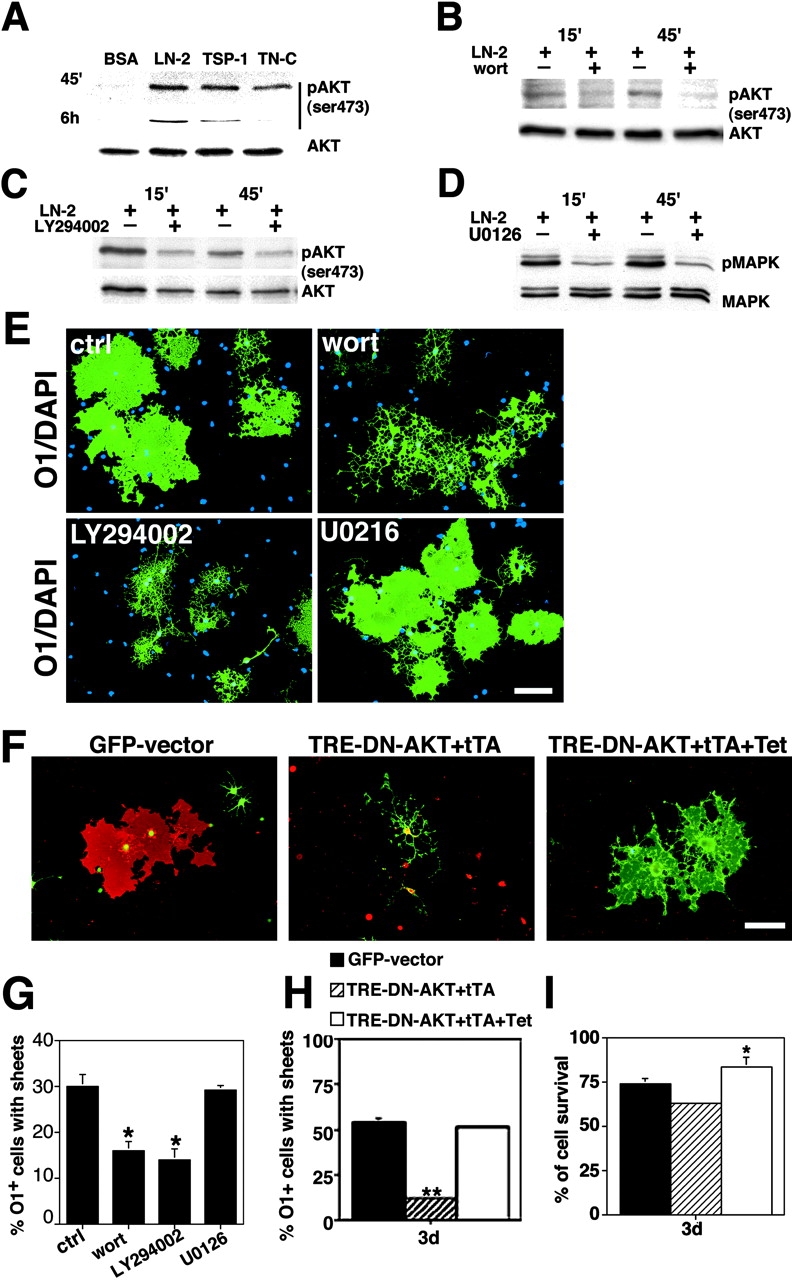
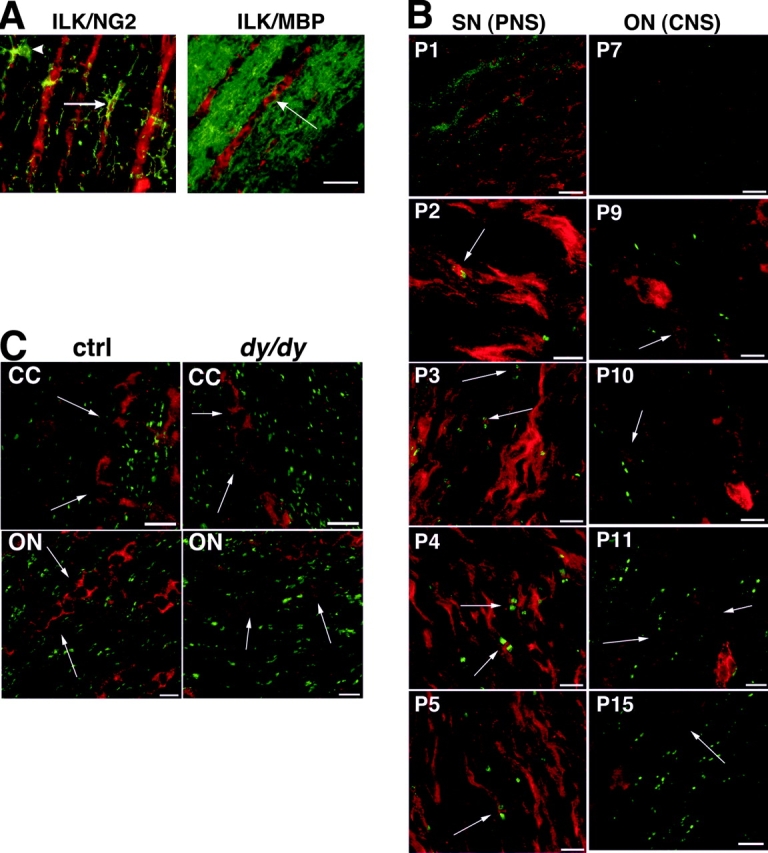
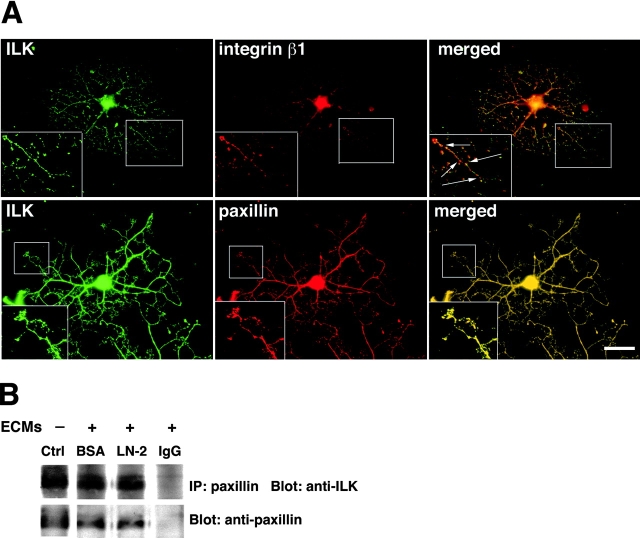
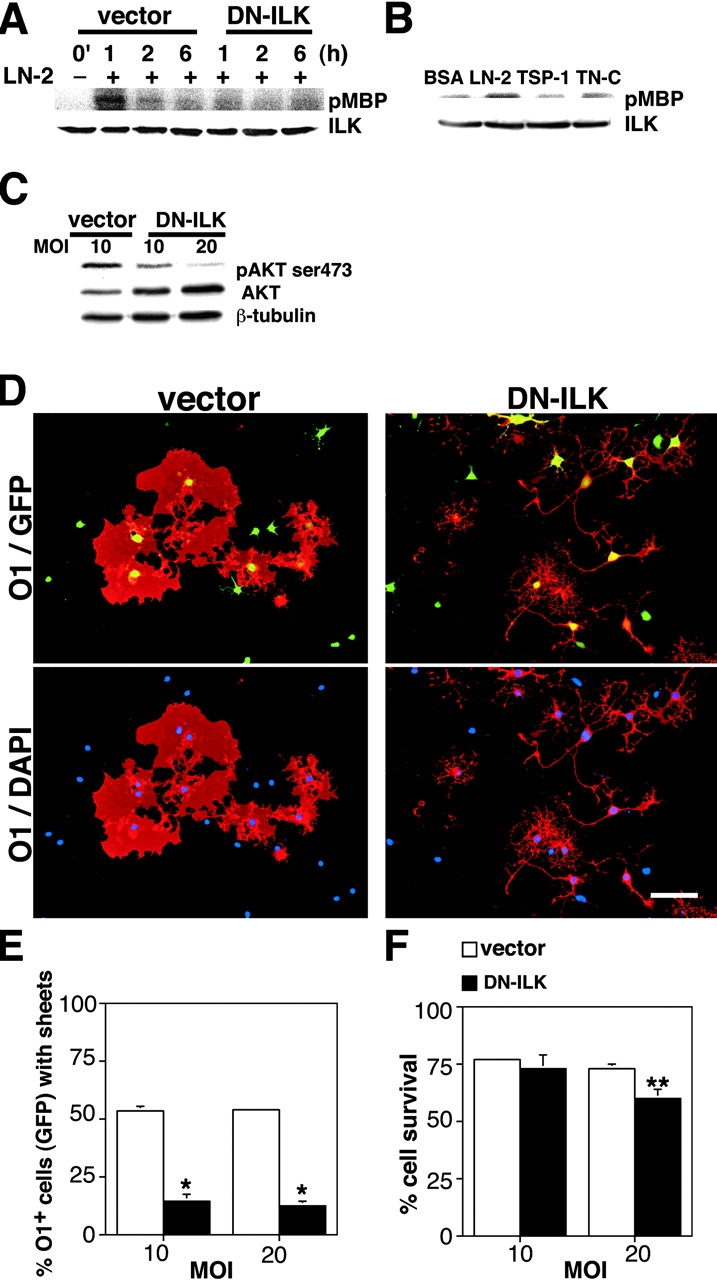
Early steps in myelination in the central nervous system (CNS) include a specialized and extreme form of cell spreading in which oligodendrocytes extend large lamellae that spiral around axons to form myelin. Recent studies have demonstrated that laminin-2 (LN-2; alpha2beta1gamma1) stimulates oligodendrocytes to extend elaborate membrane sheets in vitro (cell spreading), mediated by integrin alpha6beta1. Although a congenital LN-2 deficiency in humans is associated with CNS white matter changes, LN-2-deficient (dy/dy) mice have shown abnormalities primarily within the peripheral nervous system. Here, we demonstrate a critical role for LN-2 in CNS myelination by showing that dy/dy mice have quantitative and morphologic defects in CNS myelin. We have defined the molecular pathway through which LN-2 signals oligodendrocyte cell spreading by demonstrating requirements for phosphoinositide 3-kinase activity and integrin-linked kinase (ILK). Interaction of oligodendrocytes with LN-2 stimulates ILK activity. A dominant negative ILK inhibits LN-2-induced myelinlike membrane formation. A critical component of the myelination signaling cascade includes LN-2 and integrin signals through ILK.


Figures

Figure 1.
Figure 1.
dy/dy mice are myelin-deficient and have fewer mature oligodendrocytes in the CC. (A) Light micrographs of 6 μm paraffin-embedded coronal sections from 5-wk control (ctrl) and dy/dy mice (n = 3 of each). A reduction in the CC thickness in dy/dy mice is apparent (arrows). Total cells in the CC, a major axonal projection area of the forebrain, were stained by hematoxylin and eosin (H&E; top), and mature oligodendrocytes were immunostained for CC1 (bottom). Bar, 100 μm. (B) The total cell and mature oligodendrocyte numbers in the CC were counted in a grid of constant area at a fixed distance of 0.8 mm from the midline in 10 nonadjacent sections of ctrl and dy/dy mice. Although there is no significant difference in total cell concentration, there is a significant reduction in the concentration of CC1+ oligodendrocytes in dy/dy CC (P < 0.05, asterisks). Because the CC area is smaller in the (A) dy/dy mice, the total number of CC1+ cells in the dy/dy mice is reduced even >30%. (C) Immunoblot analysis of MBP content was performed in the brain and the SC of ctrl and dy/dy mice (n = 3). MBP level is significantly reduced in the dy/dy brain, but not in SC, compared with controls. Relative MBP levels corrected for loading with β-tubulin are shown (P < 0.005, asterisks). Results (B and C) are presented as ±SEM; and comparisons by ANOVA are significant (indicated by asterisks).
Figure 2.
Figure 2.
dy/dy mice have dysmyelinated axons in the CC and reduced myelin sheath thickness. (A) Electron micrographs from the genu of the CC, in midline sagittal sections of ctrl and dy/dy mice at 5 wk old (n = 3). Axons in the CC are hypomyelinated in dy/dy mice (top), and there are fewer small myelinated axons (<0.5 μm, arrows). Bar, 1 μm. Higher magnification (bottom) shows dysmyelination in the majority of dy/dy fibers (asterisks), consisting of noncompacted regions in which myelin lamella are separated by pockets of oligodendrocyte cytoplasm, whereas similarly processed controls show well-developed compact myelin (arrows). Bar, 300 nm. (B) Total number of axons, myelinated axons, large axons (axonal diameter; >0.5 μm) and small axons (<0.5 μm) were counted in 20 randomly selected, nonoverlapping fields from mid-sagittal sections through the genu of the CC. The total number of axons per unit area and the number of large and small myelinated axons are presented as percentages of control. The percentage of small myelinated axons is ∼30% reduced in dy/dy mice (P < 0.005, asterisk). (C) The percentage of dysmyelinated myelin sheaths is plotted. Almost 40% of the myelinated axons show noncompacted regions of myelin in dy/dy mice (P < 0.0001, asterisks), compared with controls. (D) Mean g-ratio (axon diameter/myelinated fiber diameter) was assessed for large axons. The ratio in dy/dy mice is substantially different from controls (P < 0.0001, asterisks), because even the large axons have abnormally thin myelin sheaths in the mutants. Results (B–D) are presented as ±SEM; and comparisons by ANOVA are significant (indicated by asterisks).
Figure 3.
Figure 3.
dy/dy mice show dysmyelinated axons also in the ON, but not in the SC. (A) Electron micrographs of the intracranial portion of the ON and the cervical corticospinal tracts of the SC from 5-wk control and dy/dy mice (n = 3). The ON in dy/dy (top right) contains numerous axons with dysmyelinated sheaths (asterisks), and myelin sheath thickness appears reduced for axons of all calibers. In contrast, the compactness and thickness of myelin lamellae appear indistinguishable from normal in the SP of dy/dy mice (bottom). Bars: (top) 1 μm; (bottom) 4 μm. (B) The concentration of myelinated axons was counted in 20 randomly selected, nonoverlapping fields from sections through the ON and SC. The total number of axons per unit area in dy/dy mice is expressed as percentages of the controls (ctrl). There are no differences in myelinated axon concentration in the ON or SC of ctrl and dy/dy mice. Results are presented as ±SEM; and ANOVA revealed no statistical differences. (C) Percentages of dysmyelinated sheaths are shown. The ON of dy/dy mice contain ∼15% dysmyelinated axons, a significant increase over the controls (P < 0.05, asterisks). No significant dysmyelination is observed in the SC of dy/dy mice. (D) Mean g-ratio in dy/dy mice is significantly different from controls (P < 0.001, asterisks). No decrease is observed in the abundance of myelin sheaths and no morphological deficits are found in the SC of dy/dy mice. Results (C and D) are presented ±SEM; and comparisons by ANOVA are significant (indicated by asterisks).
Figure 4.
Figure 4.
Oligodendrocytes from dy/dy brain (CC) are more responsive to LN-2 than those from the dy/dy SC. (A) Levels of LN-2 (M-chain, 80kD) were detected by immunoblot. The lysates were prepared from the SN and 10 d-mixed glial cell cultures from the CC area of brain and from the SC of P day 1 pups. The dy/dy mice show no LN-2 expression in the SN and reduced levels in the brain, compared with controls (n = 3). β-Tubulin levels were detected as a control. (B) The mixed glial cells from the brain and SC were cultured in 2% FBS for 10 d on poly-l-ornithine (PLO) or LN-2 and stained for O1 (green), as a marker for maturing oligodendrocytes, and DAPI (blue) for nuclei. Bar, 100 μm. 10 and 5% of cells from the brain and the SC showed O1+, respectively. The dy/dy cells on PLO generally failed to show cell spreading, in dramatic contrast to those cultured on LN-2. (C) The relative percentages of O1+ cells with broad myelin membrane sheets were counted. In confirmation of the image data in B, O1+ cells prepared from dy/dy brain on LN-2 showed dramatically increased oligodendrocyte cell spreading compared with those on PLO (P < 0.0001, asterisk) or compared with O1+ cells from control brain on PLO (P < 0.05, asterisks). Although O1+ cells prepared from the SC of dy/dy mice showed an increase on LN-2 than on PLO or control, the difference was not significant. Results are presented as ±SEM; and comparisons by ANOVA are significant (indicated by asterisks).
Figure 5.
Figure 5.
LN-2 promotes oligodendrocyte cell spreading in vitro. (A) Purified OPCs isolated from the rat forebrain were cultured in the presence of PDGF and basic FGF for 3 d. Cells were fixed after three further days of growth on BSA, LN-2, TSP-1, and TN-C in serum-free media with N2 supplement (N2). Cells were plated and stained for O1 (left, green) and DAPI (blue). Bar, 100 μm. (B) The relative percentages of O1+ cells with broad myelin membrane sheets on different ECM substrates were scored. LN-2 increases the ratio of O1+ cells with myelin membrane sheets to the total number of O1+ cells. Results are presented as ±SEM; and comparisons by ANOVA are significant at P < 0.0001 (indicated by asterisks). Average diameter of O1+ cells with sheets is 140 ± 20 μm in the LN-2–treated cells, compared with 90 ± 15 μm in the other ECMs-treated cells. (C) MBP levels were detected by immunoblot. The cell lysates were prepared 3 d after plating on ECMs. The MBP level on LN-2, but not on other ECMs, is increased. (D) The effects of ECMs on cell survival for 3 d were measured by the Alamar blue assay. Cells were plated on the various ECMs and incubated for 6 h, 1 d, 2 d, or 3 d. Results are presented as ±SEM; and ANOVA revealed no statistical differences in survival between the substrates.
Figure 6.
Figure 6.
Oligodendrocyte cell spreading promoted by LN-2 requires PI3K, not MAPK. (A) 45 min and 6 h after cells were plated on BSA, LN-2, TSP-1 and TN-C, phosphorylation of AKT was detected by immunoblot with AKT phospho-ser473 (pAKT) antibody. AKT levels were detected as controls. (B–D) The blocking effects of both 0.01 μM wortmannin (wort) and 0.5 μM LY294002 (PI3K inhibitors) on pAKT or of 4 μM U0126 (MAPK/ERK inhibitor) on pMAPK at 15 and 45 min were shown by immunoblot. AKT or MAPK levels were detected as controls. (E) Cells were fixed after 3 d growth on LN-2 with various inhibitors at the same concentrations used in B–D, after pretreatment for 5 min before plating and staining by O1 (green) and DAPI (blue). Bar, 100 μm. (F) OPCs were plated on LN-2 and infected with GFP-vector (20 MOI) alone or a DN-AKT (10 MOI) in serum-free media with N2 for 3 d by an adenovirus-mediated tetracycline (Tet)–off inducible system. Double staining with O1 (left, red) and GFP (left, green) or with O1 (middle and right, green) and HA-epitope–tagged DN-AKT (middle and right, red) delineates cells infected by vector or DN-AKT. Incubation of tetracycline responsive promoter (TRE)-DN-AKT (10 MOI) with tetracycline-controlled transactivator (tTA, 10 MOI) blocks LN-2–induced cell spreading by expression of DN-AKT. Incubation with 10 μg/ml Tet turned off the expression of DN-AKT, showing cell spreading as much as GFP-vector alone. Bar, 100 μm. (G) The relative percentage of O1+ cells with broad myelin membrane sheets on LN-2 with various inhibitors is shown. Treatment with PI3K inhibitors reduces myelin membrane formation up to 50% (P < 0.005, asterisks). MAPK inhibitor had no influence on myelin membrane formation. (H) The relative percentage of O1+ cells with broad myelin membrane sheets is shown. Incubation of TRE-DN-AKT (10 MOI) with tTA (10 MOI) decreases cell spreading up to 75% compared with 20 MOI GFP-vector alone (P < 0.0001, asterisks). Incubation with 10 μg/ml Tet increases cell spreading up to 50%. (I) Cell survival was measured by the Live/Dead Cytotoxicity assay. There is no statistical difference in cell survival between vector alone (20 MOI) and TRE-DN-AKT (10 MOI) + tTA (10 MOI), whereas addition of Tet increases cell survival (P < 0.05, asterisk). Results (G–I) are presented as ±SEM; and comparisons by ANOVA are significant (indicated by asterisks).
Figure 7.
Figure 7.
ILK is expressed in the developing CNS and PNS. (A) Double staining for ILK (left, red) and NG2 (left, green) or MBP (right, green) in rat CNS ON. Most sites of NG2 immunoreactivity, including cell bodies (arrowhead) are devoid of ILK staining, although occasionally NG2-positive cells are also ILK positive (arrow). In MBP-positive cells, The ILK staining is restricted to long rows of cells residing between fascicles of myelinated axons (arrow). Bar, 10 μm. (B) ILK expression patterns during development of Sprague-Dawley rat SN (left, P days: P1–5) and of rat CNS ON (right, P7, P9–11, and P15). The SN shows localization of ILK (red) to the cytoplasm of Schwann cells at nodes of Ranvier (arrows) throughout the early P developmental phase. In the ON, ILK (red) is restricted to oligodendrocyte cell bodies (arrows), whereas the protein Caspr (green), restricted to paranodal axoglial junctions, serves as a marker of myelination. At P7, myelin has not yet formed, as evidenced by the lack of Caspr staining, and oligodendrocytes do not yet stain for ILK. From P9 onward, both stains are positive. Bars, 10 μm. (C) Double staining with ILK (red) and Caspr (green) in the CC and ON of 5-wk control and dy/dy mice. ILK in the CC and the ON of these animals is localized to oligodendrocyte cell bodies. Expression pattern of ILK does not differ significantly between control and dy/dy mice, whereas there appears to be a difference in Caspr immunoreactivity, suggesting paranodal abnormalities. Bars, 10 μm.
Figure 8.
Figure 8.
ILK is expressed in oligodendrocytes in vitro and colocalizes with the FA-associated molecules, integrin β1 and paxillin. (A) OPCs isolated from P2 Sprague-Dawley rat forebrain were stimulated to differentiate in vitro, and cells were double stained with ILK (green) and integrin β1 (red) or paxillin (red) in differentiated oligodendrocytes plated on LN-2. ILK is distributed throughout the cell body and processes, including the tips of processes (top left) and growth cone–like termini (bottom left) of oligodendrocytes. Higher magnification of merged images (the boxed areas) demonstrates that ILK colocalizes with integrin β1 and paxillin in FAs (arrows). Although integrin β1 is partly colocalized with ILK throughout the cell body and processes, paxillin colocalizes with ILK in every part of the cell. Bar, 30 μm. (B) OPCs were plated and then incubated for 30 min either with ECMs (BSA and LN-2 [with or without IgG]) or without ECMs (Ctrl) and were lysed in NP-40 lysis buffer. Paxillin and control mouse IgG immunoprecipitations were performed and subjected to SDS-PAGE followed by immunoblot with antibodies against ILK. ILK coimmunoprecipitates with the paxillin antibody as compared with the control IgG. Total amounts of lysates were detected by antipaxillin antibody. The results suggest that the ILK–paxillin interaction is constitutive rather than adhesion induced.
Figure 9.
Figure 9.
LN-2 activates ILK activity and DN-ILK inhibits oligodendrocyte cell spreading. (A) OPCs were transfected with 10 MOI vector alone as a control or with DN-ILK (kinase-inactive form of ILK) by adenovirus gene transfer. After 24 h, transfectants were plated on LN-2 in serum-free media with N2 and cultured for the indicated time periods. ILK was immunoprecipitated from cell extracts. ILK activity was determined with MBP as an exogenous substrate. Total amounts of ILK proteins in the immunoprecipitates were detected by immunoblot with an anti-ILK antibody. Results indicate that LN-2 stimulates ILK activity. (B) 1 h after cells were plated on BSA, LN-2, TSP-1, and TN-C. ILK activity was detected by phosphorylation of MBP. ILK levels were detected as controls. LN-2 stimulates ILK activity more effectively than any of the other ECMs at 1h (P < 0.5) (C) The blocking effect of DN-ILK on pAKT ser473 was investigated by immunoblot. Cells were plated on LN-2 and incubated with 10 MOI vector or 10 or 20 MOI DN-ILK for 3 d. Compared with vector, DN-ILK blocks phosphorylation of AKT ser473. AKT and β-tubulin serve as standards for the total amount of protein. (D) OPCs were plated on LN-2 and incubated with 10 or 20 MOI GFP-vector or GFP-DN-ILK in serum-free media with N2 for 3 d. Cells were fixed and stained for O1 (red) and with DAPI for nuclei (blue). Double staining with O1 and GFP (top) or with O1 and DAPI (bottom) delineates cells infected by vector or DN-ILK. DN-ILK blocks LN-2–induced cell spreading. Bar, 100 μm. (E) The relative percentage of GFP-expressing O1+ cells with broad myelin membrane sheets is shown. 20 MOI DN-ILK decreases cell spreading up to 75% compared with vector alone (P < 0.005, asterisks). (F) Cell survival was measured by the Live/Dead Cytotoxicity assay. There is no statistical difference in cell survival between 10 MOI vector and 10 MOI DN-ILK, whereas 20 MOI DN-ILK induces cell death (P < 0.01, asterisks). (E and F) Results are presented as ±SEM; and comparisons by ANOVA are significant (indicated by asterisks).

References

    1. Back, S.A., R. Khan, X. Gan, P.A. Rosenberg, and J.J. Volpe. 1999. A new Alamar blue viability assay to rapidly quantify oligodendrocyte death. J. Neurosci. Methods. 91:47–54. - PubMed
    1. Biffiger, K., S. Bartsch, D. Montag, A. Aguzzi, M. Schachner, and U. Bartsch. 2000. Severe hypomyelination of the murine CNS in the absence of myelin-associated glycoprotein and fyn tyrosine kinase. J. Neurosci. 20:7430–7437. - PMC - PubMed
    1. Bjartmar, C., C. Hildebrand, and K. Loinder. 1994. Morphological heterogeneity of rat oligodendrocytes: electron microscopic studies on serial sections. Glia. 11:235–244. - PubMed
    1. Bradley, W.G., and E. Jaros. 1979. Involvement of peripheral and central nerves in murine dystrophy. Ann NY Acad Sci. 317:132–142. - PubMed
    1. Buttery, P.C., and C. ffrench-Constant. 1999. Laminin-2/integrin interactions enhance myelin membrane formation by oligodendrocytes. Mol. Cell. Neurosci. 14:199–212. - PubMed

Publication types

MeSH terms