

Relationship between in vitro human immunodeficiency virus type 1 replication rate and virus load in plasma
- PMID: 14581547
- PMCID: PMC253754
- DOI: 10.1128/jvi.77.22.12105-12112.2003
Relationship between in vitro human immunodeficiency virus type 1 replication rate and virus load in plasma
Abstract
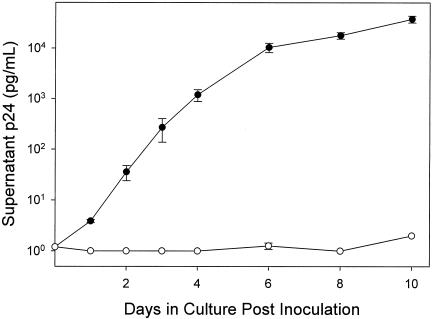
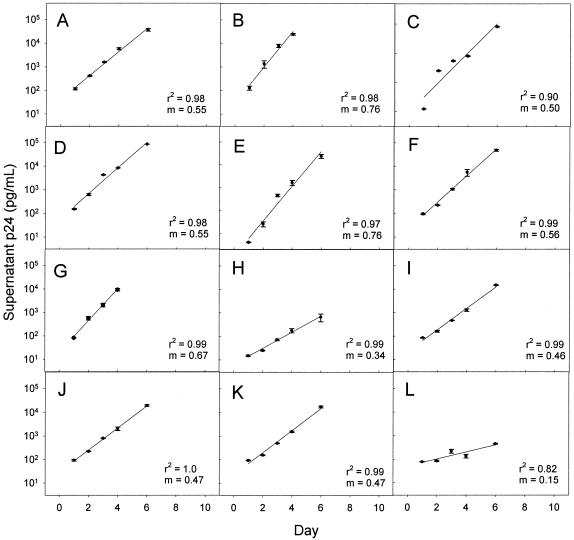
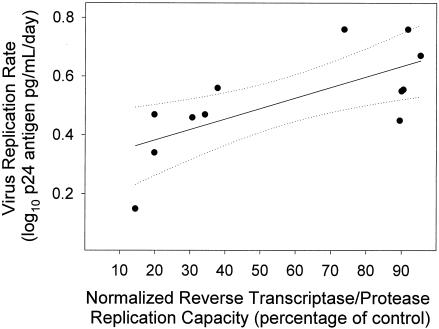
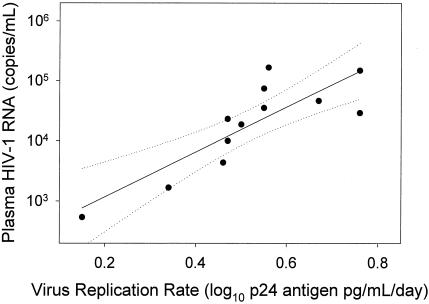
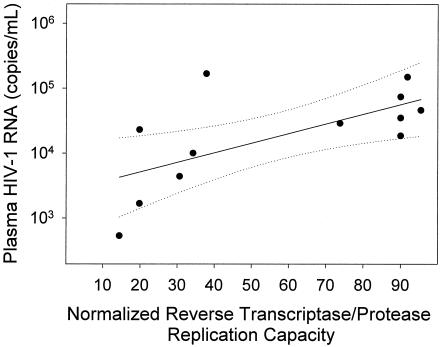
Although plasma human immunodeficiency virus type 1 (HIV-1) RNA concentration is a major determinant of the rate of HIV-1 disease progression, the reasons for variability in plasma virus loads among infected individuals are not fully understood. We conducted investigations with 15 HIV-1-infected individuals who were not receiving antiretroviral therapy to evaluate the hypothesis that HIV-1 replication rate in vitro is a significant determinant of plasma virus load. Virus could not be isolated from one subject. Two subjects were excluded because they had features previously associated with distinct plasma virus loads and altered rates of disease progression; one harbored a syncytium-inducing virus and the second was heterozygous for a 32-bp deletion from the CCR5 gene. HIV-1 replication rates were determined by culturing autologous virus isolates in phytohemagglutinin-treated peripheral blood mononuclear cells (PBMC) and determining the rate of p24 antigen production during the logarithmic phase of viral replication. The contribution of HIV-1 reverse transcriptase (RT) and protease (PR) alleles to replication capacity was assessed using recombinant viruses in a single-cycle infection assay. HIV-1 replication rates ranged from 0.15 to 0.76 log(10) pg/ml/day and were reproducible within the same donor PBMC (coefficient of variation +/- 4%). RT-PR replication capacity ranged from 14 to 95% of that of control virus and was linearly related to replication rate (r(2) = 0.53; P = 0.007). Plasma HIV-1 RNA concentration was linearly related to replication rate (r(2) = 0.71; P < 0.001) and RT-PR replication capacity (r(2) = 0.44; P = 0.019). These data suggest that different RT-PR alleles are important determinants of HIV-1 replication rates and that HIV-1 replication rate explains much of the variability in plasma virus load in chronic HIV-1 infection.
Figures
References
-
- Addo, M. M., X. G. Yu, A. Rathod, D. Cohen, R. L. Eldridge, D. Strick, M. N. Johnston, C. Corcoran, A. G. Wurcel, C. A. Fitzpatrick, M. E. Feeney, W. R. Rodriguez, N. Basgoz, R. Draenert, D. R. Stone, C. Brander, P. J. Goulder, E. S. Rosenberg, M. Altfeld, and B. D. Walker. 2003. Comprehensive epitope analysis of human immunodeficiency virus type 1 (HIV-1)-specific T-cell responses directed against the entire expressed HIV-1 genome demonstrate broadly directed responses, but no correlation to viral load. J. Virol. 77:2081-2092. - PMC - PubMed
-
- Altfeld, M., E. S. Rosenberg, R. Shankarappa, J. S. Mukherjee, F. M. Hecht, R. L. Eldridge, M. M. Addo, S. H. Poon, M. N. Phillips, G. K. Robbins, P. E. Sax, S. Boswell, J. O. Kahn, C. Brander, P. J. Goulder, J. A. Levy, J. I. Mullins, and B. D. Walker. 2001. Cellular immune responses and viral diversity in individuals treated during acute and early HIV-1 infection. J. Exp. Med. 193:169-180. - PMC - PubMed
-
- Asjo, B., L. Morfeldt-Manson, J. Albert, G. Biberfeld, A. Karlsson, K. Lidman, and E. M. Fenyo. 1986. Replicative capacity of human immunodeficiency virus from patients with varying severity of HIV infection. Lancet ii:660-662. - PubMed
-
- Betts, M. R., D. R. Ambrozak, D. C. Douek, S. Bonhoeffer, J. M. Brenchley, J. P. Casazza, R. A. Koup, and L. J. Picker. 2001. Analysis of total human immunodeficiency virus (HIV)-specific CD4+ and CD8+ T-cell responses: relationship to viral load in untreated HIV infection. J. Virol. 75:11983-11991. - PMC - PubMed
-
- Blaak, H., M. Brouwer, L. J. Ran, F. de Wolf, and H. Schuitemaker. 1998. In vitro replication kinetics of human immunodeficiency virus type 1 (HIV-1) variants in relation to virus load in long-term survivors of HIV-1 infection. J. Infect. Dis. 177:600-610. - PubMed
Publication types
MeSH terms
Substances
Grants and funding
LinkOut - more resources
Full Text Sources
Other Literature Sources
Research Materials
