. 2003 Nov 3;198(9):1369-80.
doi: 10.1084/jem.20030916. Epub 2003 Oct 27.

CD27 promotes survival of activated T cells and complements CD28 in generation and establishment of the effector T cell pool

Affiliations

CD27 promotes survival of activated T cells and complements CD28 in generation and establishment of the effector T cell pool

Jenny Hendriks et al. J Exp Med. .

Abstract

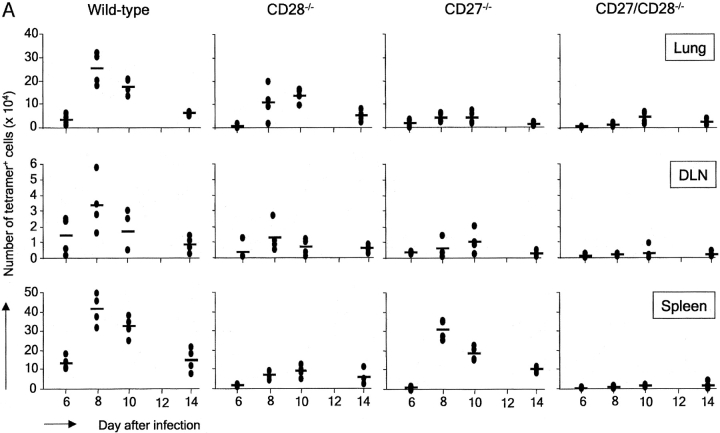
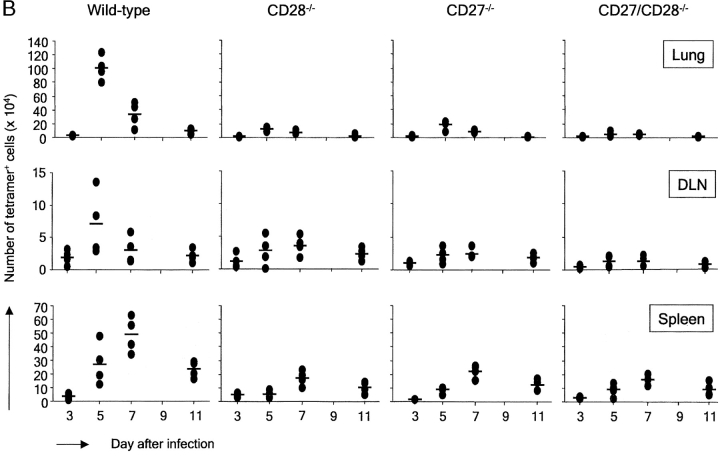
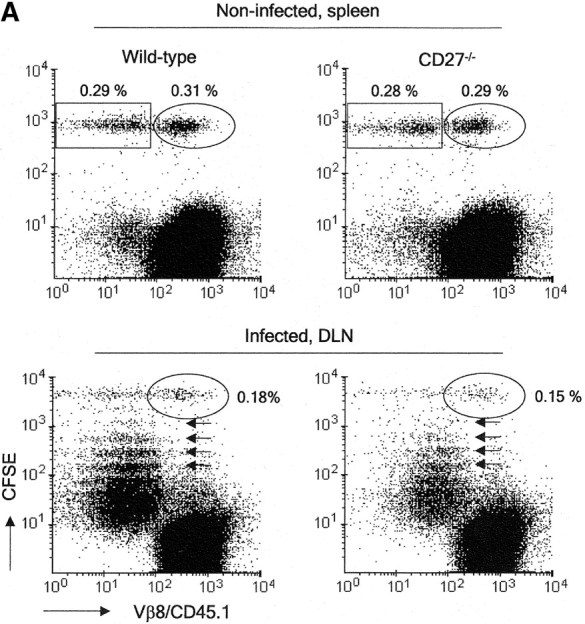
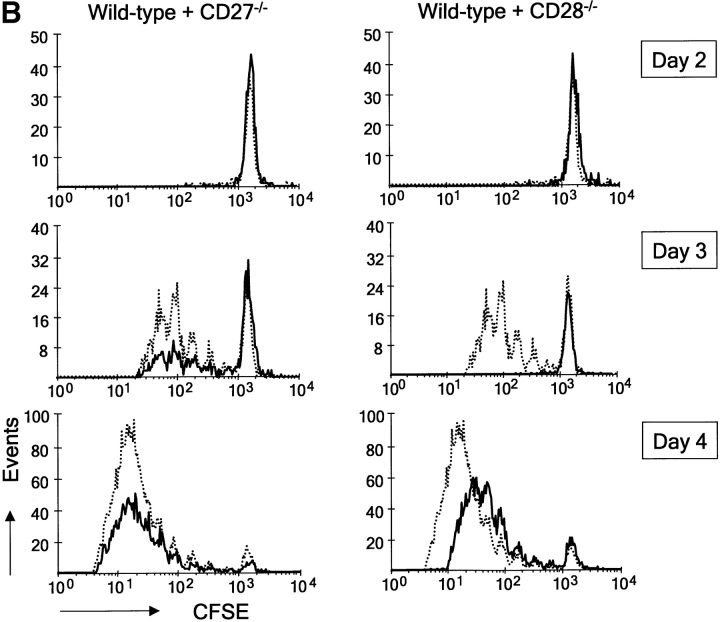
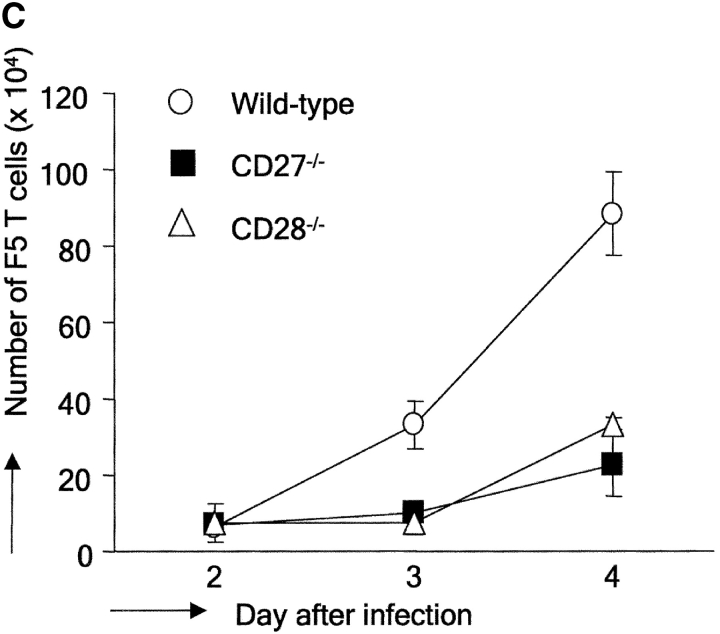
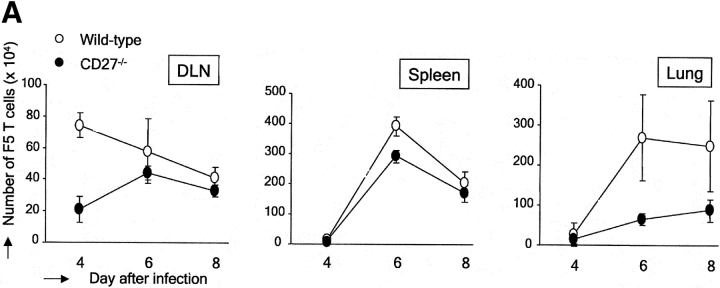
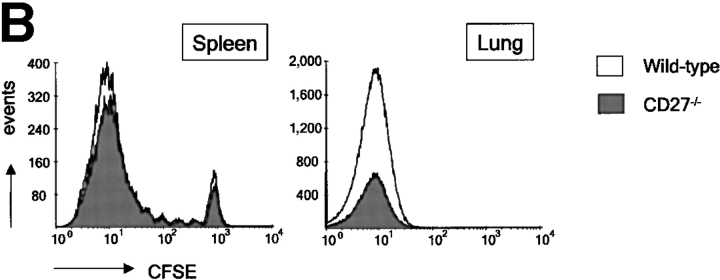
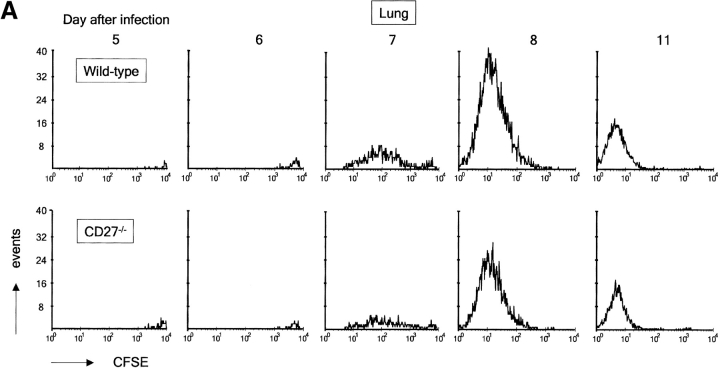
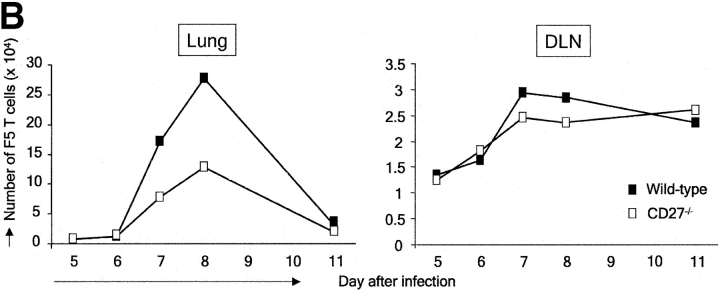
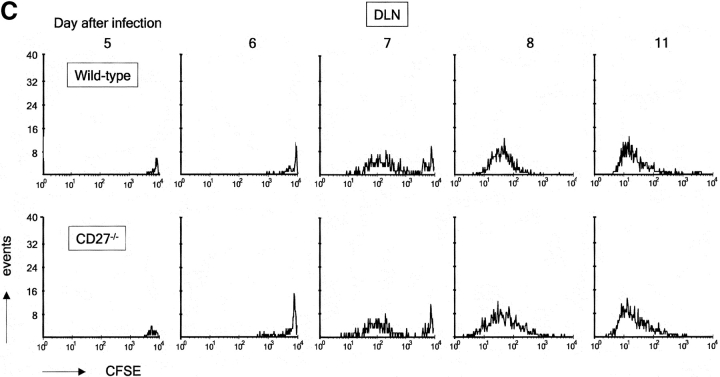
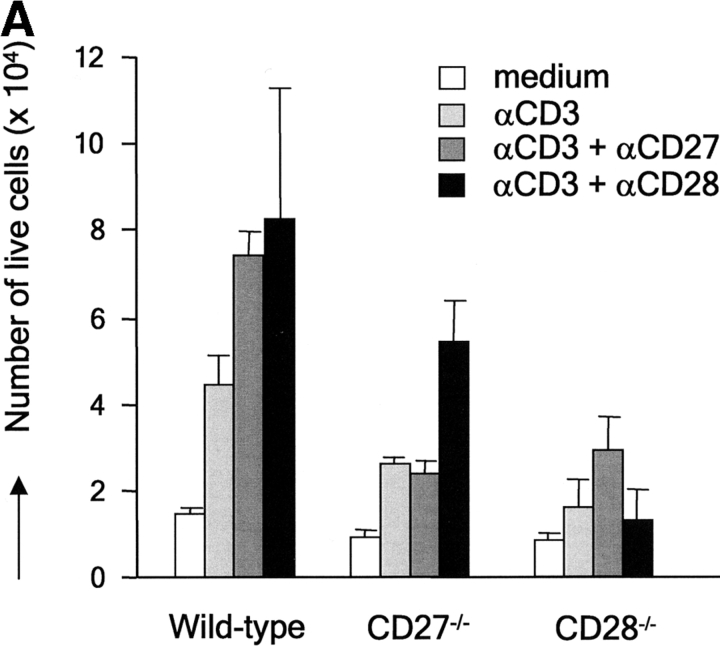
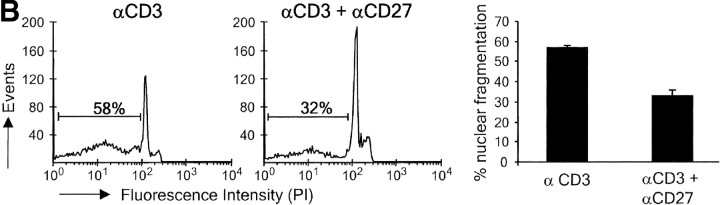
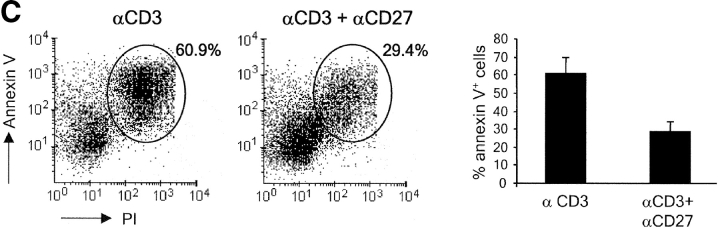
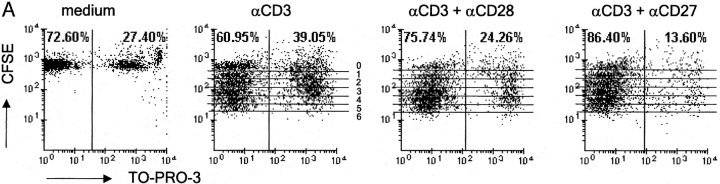
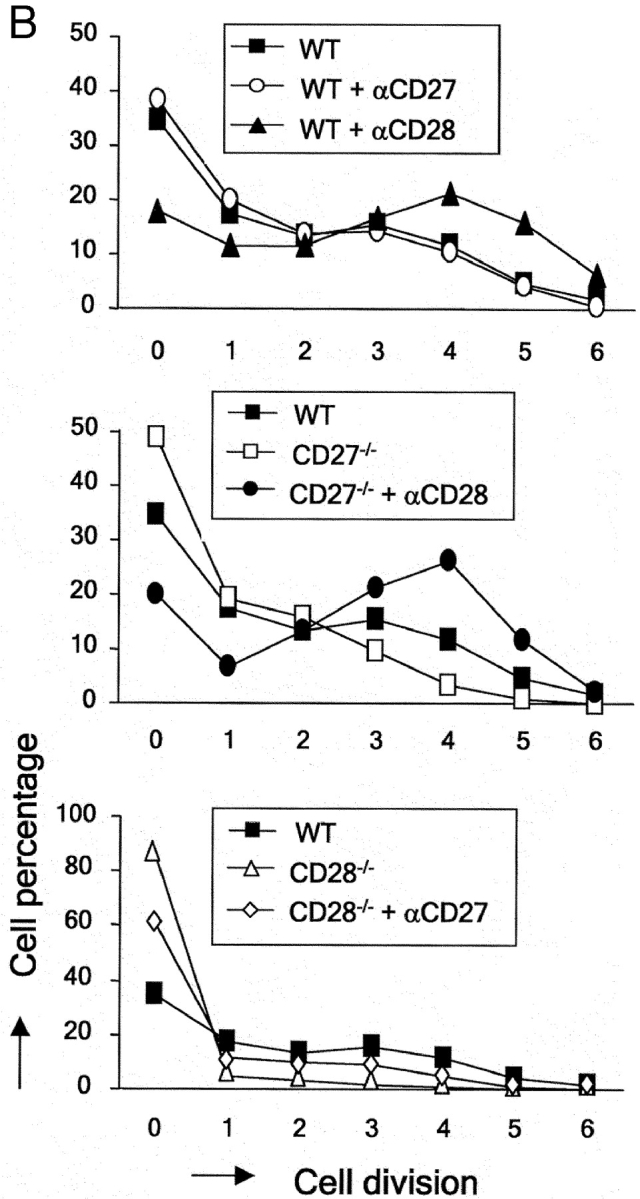
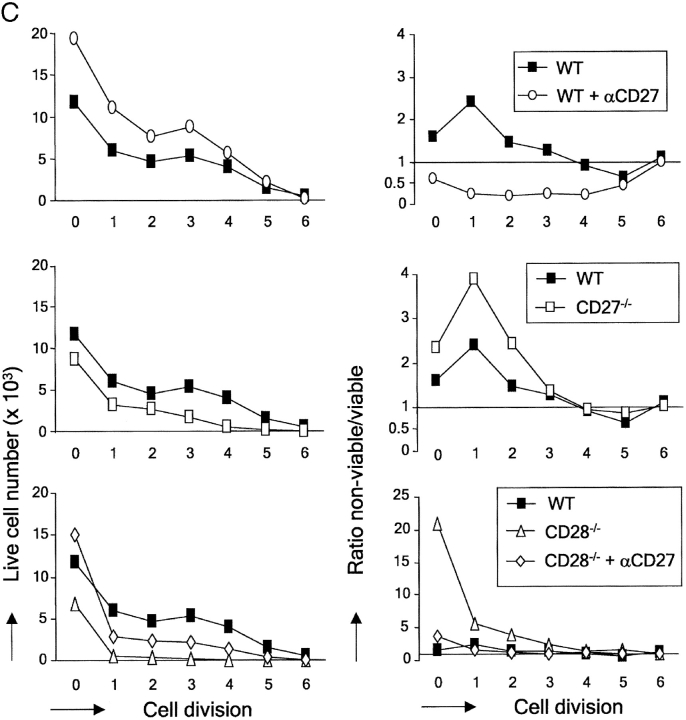
CD27, like CD28, acts in concert with the T cell receptor to support T cell expansion. Using CD27(-/-) mice, we have shown earlier that CD27 determines the magnitude of primary and memory T cell responses to influenza virus. Here, we have examined the relative contributions of CD27 and CD28 to generation of the virus-specific effector T cell pool and its establishment at the site of infection (the lung), using CD27(-/-), CD28(-/-), and CD27/CD28(-/-) mice. We find that primary and memory CD8+ T cell responses to influenza virus are dependent on the collective contribution of both receptors. In the primary response, CD27 and CD28 impact to a similar extent on expansion of virus-specific T cells in draining lymph nodes. CD27 is the principle determinant for accumulation of virus-specific T cells in the lung because it can sustain this response in CD28(-/-) mice. Unlike CD28, CD27 does not affect cell cycle activity, but promotes survival of activated T cells throughout successive rounds of division at the site of priming and may do so at the site of infection as well. CD27 was found to rescue CD28(-/-) T cells from death at the onset of division, explaining its capacity to support a T cell response in absence of CD28.


Figures

Figure 1.
Figure 1.
In vivo primary and memory T cell responses to influenza virus in the presence or absence of CD27 and/or CD28. Wild-type, CD27−/−, CD28−/−, and CD27−/−/CD28−/− mice were infected intranasally with influenza virus. Cells were isolated from the lung, DLNs, and spleen on the indicated days after infection. They were counted, stained with anti-CD8 mAb and NP366–374/H2-Db tetramers, and analyzed by flow cytometry. Each symbol represents an individual mouse (four per group) and dashes represent mean values. (A) Primary response. (B) Memory response. The complete experiment was performed two times with reproducible results.
Figure 1.
Figure 1.
In vivo primary and memory T cell responses to influenza virus in the presence or absence of CD27 and/or CD28. Wild-type, CD27−/−, CD28−/−, and CD27−/−/CD28−/− mice were infected intranasally with influenza virus. Cells were isolated from the lung, DLNs, and spleen on the indicated days after infection. They were counted, stained with anti-CD8 mAb and NP366–374/H2-Db tetramers, and analyzed by flow cytometry. Each symbol represents an individual mouse (four per group) and dashes represent mean values. (A) Primary response. (B) Memory response. The complete experiment was performed two times with reproducible results.
Figure 2.
Figure 2.
Impact of CD27 or CD28 deletion on division and accumulation of influenza virus-specific T cells in DLNs. CD45.1+ recipient mice were injected with a 1:1 mix of CD45.1 CFSE-labeled F5 and H-Y TCR transgenic naive T cells and infected with influenza virus 2 d later. (A) Recovery of CFSE-labeled wild-type or CD27−/− T cells from the spleen of noninfected recipient mice at day 8 after adoptive transfer, or from DLNs of recipient mice at day 4 after virus infection. The circles indicate nonresponding Vβ8+ H-Y T cells, rectangles Vβ8 F5 T cells, small arrows indicate divisions in the responding F5 population. Percentages of H-Y and F5 T cells were calculated relative to recipient cells. (B) DLNs were harvested at day 2, 3, or 4 after infection. To standardize recovery of F5 T cells, 1,000 H-Y T cells were collected. Wild-type (solid line), CD27−/−, or CD28−/− (dotted lines) F5 T cell responses are quantitatively compared by overlay of CFSE histograms. (C) Kinetics of accumulation of wild-type, CD27−/−, and CD28−/− F5 responder T cells in DLNs of influenza virus-infected mice. The absolute numbers of F5 T cells were calculated from the total number of cells and the percentage of F5 T cells (Vβ8/CD45.1). Means and standard deviations were derived from four mice per time point out of two independent experiments.
Figure 2.
Figure 2.
Impact of CD27 or CD28 deletion on division and accumulation of influenza virus-specific T cells in DLNs. CD45.1+ recipient mice were injected with a 1:1 mix of CD45.1 CFSE-labeled F5 and H-Y TCR transgenic naive T cells and infected with influenza virus 2 d later. (A) Recovery of CFSE-labeled wild-type or CD27−/− T cells from the spleen of noninfected recipient mice at day 8 after adoptive transfer, or from DLNs of recipient mice at day 4 after virus infection. The circles indicate nonresponding Vβ8+ H-Y T cells, rectangles Vβ8 F5 T cells, small arrows indicate divisions in the responding F5 population. Percentages of H-Y and F5 T cells were calculated relative to recipient cells. (B) DLNs were harvested at day 2, 3, or 4 after infection. To standardize recovery of F5 T cells, 1,000 H-Y T cells were collected. Wild-type (solid line), CD27−/−, or CD28−/− (dotted lines) F5 T cell responses are quantitatively compared by overlay of CFSE histograms. (C) Kinetics of accumulation of wild-type, CD27−/−, and CD28−/− F5 responder T cells in DLNs of influenza virus-infected mice. The absolute numbers of F5 T cells were calculated from the total number of cells and the percentage of F5 T cells (Vβ8/CD45.1). Means and standard deviations were derived from four mice per time point out of two independent experiments.
Figure 3.
Figure 3.
Impact of CD27 deletion on accumulation of influenza virus-specific T cells in the spleen and lung. Adoptive transfer was performed as outlined for Fig. 2. To standardize recovery of F5 responder T cells, 500 nonresponder H-Y T cells were collected from the lung and 1,000 from the spleen and DLNs. (A) Kinetics of accumulation of wild-type and CD27−/− F5 responder T cells. The absolute numbers of F5 T cells were calculated as indicated for Fig. 2 C. Means and standard deviations are derived from four mice per time point out of two independent experiments. (B) Quantitative comparison of CFSE profiles of wild-type and CD27−/− F5 T cells in the spleen and lung at day 6 after infection. Results are representative of at least two independent experiments.
Figure 3.
Figure 3.
Impact of CD27 deletion on accumulation of influenza virus-specific T cells in the spleen and lung. Adoptive transfer was performed as outlined for Fig. 2. To standardize recovery of F5 responder T cells, 500 nonresponder H-Y T cells were collected from the lung and 1,000 from the spleen and DLNs. (A) Kinetics of accumulation of wild-type and CD27−/− F5 responder T cells. The absolute numbers of F5 T cells were calculated as indicated for Fig. 2 C. Means and standard deviations are derived from four mice per time point out of two independent experiments. (B) Quantitative comparison of CFSE profiles of wild-type and CD27−/− F5 T cells in the spleen and lung at day 6 after infection. Results are representative of at least two independent experiments.
Figure 4.
Figure 4.
Impact of CD27 deletion on division of influenza virus-specific T cells recovered from the lung. Recipient mice were injected with naive F5 T cells and infected. At day 4 after infection, T cells were purified from DLNs and labeled with CFSE. Together with the H-Y T cell standard, these were injected into recipient mice, which had been infected with influenza virus at the same time point as donor mice. Day 5 after infection corresponds with day 1 after transfer. Donor F5 T cells were discriminated from T cells of the first recipient by means of the CD45.1 marker. (A) Quantitative comparison of CFSE profiles indicating cell divisions of wild-type and CD27−/− F5 T cells in the lung at the indicated days after virus infection. (B) Accumulation of F5 T cells in lung and DLNs of virus-infected mice in the days after adoptive transfer. Data points are means of two mice. Results are representative of at least two independent experiments. (C) Quantitative comparison of CFSE profiles indicating cell divisions of wild-type and CD27−/− F5 T cells in DLNs at the indicated days after virus infection.
Figure 4.
Figure 4.
Impact of CD27 deletion on division of influenza virus-specific T cells recovered from the lung. Recipient mice were injected with naive F5 T cells and infected. At day 4 after infection, T cells were purified from DLNs and labeled with CFSE. Together with the H-Y T cell standard, these were injected into recipient mice, which had been infected with influenza virus at the same time point as donor mice. Day 5 after infection corresponds with day 1 after transfer. Donor F5 T cells were discriminated from T cells of the first recipient by means of the CD45.1 marker. (A) Quantitative comparison of CFSE profiles indicating cell divisions of wild-type and CD27−/− F5 T cells in the lung at the indicated days after virus infection. (B) Accumulation of F5 T cells in lung and DLNs of virus-infected mice in the days after adoptive transfer. Data points are means of two mice. Results are representative of at least two independent experiments. (C) Quantitative comparison of CFSE profiles indicating cell divisions of wild-type and CD27−/− F5 T cells in DLNs at the indicated days after virus infection.
Figure 5.
Figure 5.
CD27 promotes yield of live activated T cells and counteracts apoptosis in vitro. Purified T cells from wild-type, CD27−/−, or CD28−/− mice were stimulated for 72 h with anti-CD3 mAb in the presence or absence of anti-CD27 or anti-CD28 mAb, as indicated. (A) Live cells were counted using an automated cell counter. Means and standard deviations were derived from four cultures of two separate experiments. (B) Incidence of apoptosis as read out by nuclear fragmentation. Representative histograms with the percentage of apoptotic events. The bar diagram shows the mean percentages and standard deviations of apoptotic events determined in three separate experiments. (C) Incidence of apoptosis as read out by annexin V binding. Percentages indicate the proportion of annexin V+ cells (encircled). PIhigh cells were excluded from the analysis. The bar diagram shows the mean percentages and standard deviations of annexin V+ cells determined in three separate experiments.
Figure 5.
Figure 5.
CD27 promotes yield of live activated T cells and counteracts apoptosis in vitro. Purified T cells from wild-type, CD27−/−, or CD28−/− mice were stimulated for 72 h with anti-CD3 mAb in the presence or absence of anti-CD27 or anti-CD28 mAb, as indicated. (A) Live cells were counted using an automated cell counter. Means and standard deviations were derived from four cultures of two separate experiments. (B) Incidence of apoptosis as read out by nuclear fragmentation. Representative histograms with the percentage of apoptotic events. The bar diagram shows the mean percentages and standard deviations of apoptotic events determined in three separate experiments. (C) Incidence of apoptosis as read out by annexin V binding. Percentages indicate the proportion of annexin V+ cells (encircled). PIhigh cells were excluded from the analysis. The bar diagram shows the mean percentages and standard deviations of annexin V+ cells determined in three separate experiments.
Figure 6.
Figure 6.
CD27 does not affect cell division but promotes survival and yield of live activated T cells in vitro in the presence and absence of CD28. Purified T cells were stimulated as indicated for Fig. 5. Cells were stained with TO-PRO-3 dye at the end of the culture period and the total cell population was analyzed by flow cytometry. (A) Dot plots showing CFSE and TO-PRO-3 fluorescence intensities and the overall percentage of TO-PRO-3 (viable) and TO-PRO-3+ (nonviable) cells. Lines mark each division round according to CFSE dilution. Division rounds are indicated by numbers 1–6. (B) The percentage of total cells (viable and nonviable) present in each cell division round was determined for wild-type (WT), CD27−/−, or CD28−/− T cells, costimulated with anti-CD27 or anti-CD28 mAb. (C) Live cell yield was calculated per cell division from the total number of cells in the culture and the percentage viable cells in discrete CFSE+ cell populations with successive diminishing fluorescence intensities (indicated by the lines in A). The ratio of nonviable/viable cells per division was calculated from the percentages. Data points represent means of duplicate cultures. Results are representative of four independent experiments.
Figure 6.
Figure 6.
CD27 does not affect cell division but promotes survival and yield of live activated T cells in vitro in the presence and absence of CD28. Purified T cells were stimulated as indicated for Fig. 5. Cells were stained with TO-PRO-3 dye at the end of the culture period and the total cell population was analyzed by flow cytometry. (A) Dot plots showing CFSE and TO-PRO-3 fluorescence intensities and the overall percentage of TO-PRO-3 (viable) and TO-PRO-3+ (nonviable) cells. Lines mark each division round according to CFSE dilution. Division rounds are indicated by numbers 1–6. (B) The percentage of total cells (viable and nonviable) present in each cell division round was determined for wild-type (WT), CD27−/−, or CD28−/− T cells, costimulated with anti-CD27 or anti-CD28 mAb. (C) Live cell yield was calculated per cell division from the total number of cells in the culture and the percentage viable cells in discrete CFSE+ cell populations with successive diminishing fluorescence intensities (indicated by the lines in A). The ratio of nonviable/viable cells per division was calculated from the percentages. Data points represent means of duplicate cultures. Results are representative of four independent experiments.

Similar articles

Cited by

References

    1. Viola, A., S. Schroeder, Y. Sakakibara, and A. Lanzavecchia. 1999. T lymphocyte costimulation mediated by reorganization of membrane microdomains. Science. 283:680–682. - PubMed
    1. Wells, A.D., H. Gudmundsdottir, and L.A. Turka. 1997. Following the fate of individual T cells throughout activation and clonal expansion. J. Clin. Invest. 100:3137–3183. - PMC - PubMed
    1. Noel, P.J., L.H. Boise, J.M. Green, and C.B. Thompson. 1996. CD28 costimulation prevents cell death during primary T cell activation. J. Immunol. 157:636–642. - PubMed
    1. Okkenhaug, K., L. Wu, K.M. Garza, J. La Rose, W. Khoo, N. Odermatt, T.W. Mak, P. Ohashi, and R. Rottapel. 2001. A point mutation in CD28 distinghuishes proliferative signals from survival signals. Nat. Immunol. 2:325–332. - PubMed
    1. Watts, T.H., and M.A. DeBenedette. 1999. T cell costimulatory molecules other than CD28. Curr. Opin. Immunol. 11:286–293. - PubMed

Publication types

MeSH terms

Substances