

Robust singular value decomposition analysis of microarray data
- PMID: 14581611
- PMCID: PMC263735
- DOI: 10.1073/pnas.1733249100
Robust singular value decomposition analysis of microarray data
Abstract
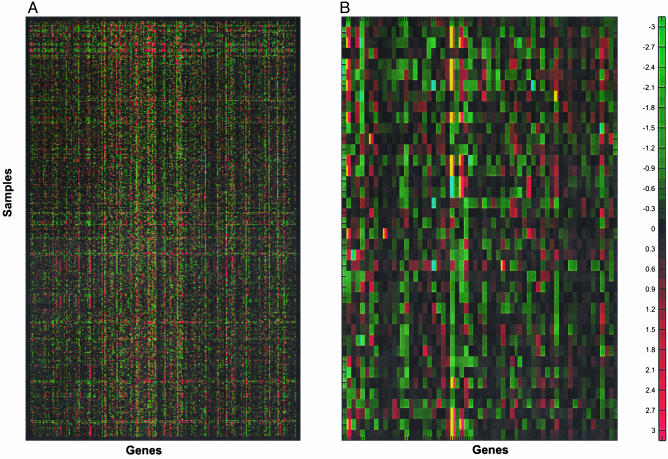
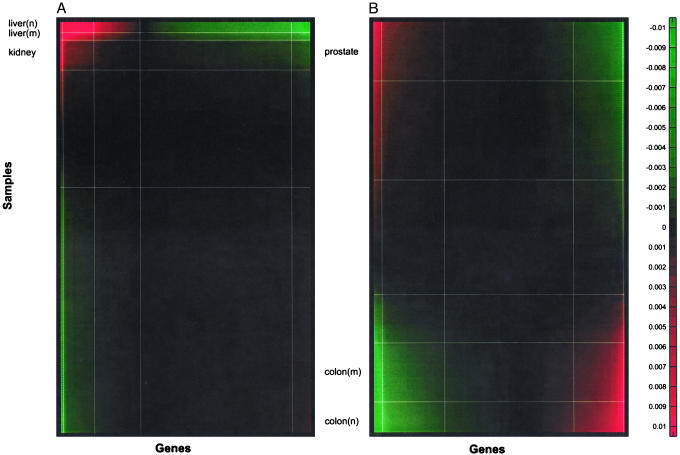
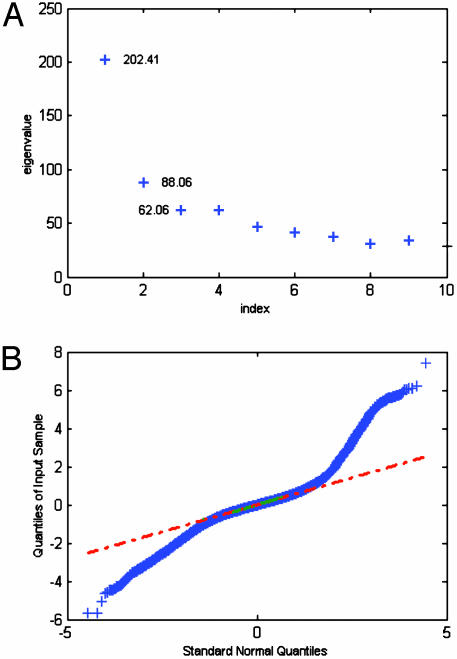
In microarray data there are a number of biological samples, each assessed for the level of gene expression for a typically large number of genes. There is a need to examine these data with statistical techniques to help discern possible patterns in the data. Our technique applies a combination of mathematical and statistical methods to progressively take the data set apart so that different aspects can be examined for both general patterns and very specific effects. Unfortunately, these data tables are often corrupted with extreme values (outliers), missing values, and non-normal distributions that preclude standard analysis. We develop a robust analysis method to address these problems. The benefits of this robust analysis will be both the understanding of large-scale shifts in gene effects and the isolation of particular sample-by-gene effects that might be either unusual interactions or the result of experimental flaws. Our method requires a single pass and does not resort to complex "cleaning" or imputation of the data table before analysis. We illustrate the method with a commercial data set.
Figures
Similar articles
-
Robust imputation method for missing values in microarray data.BMC Bioinformatics. 2007 May 3;8 Suppl 2(Suppl 2):S6. doi: 10.1186/1471-2105-8-S2-S6. BMC Bioinformatics. 2007. PMID: 17493255 Free PMC article.
-
DNA microarray data imputation and significance analysis of differential expression.Bioinformatics. 2005 Nov 15;21(22):4155-61. doi: 10.1093/bioinformatics/bti638. Epub 2005 Aug 23. Bioinformatics. 2005. PMID: 16118262
-
Including probe-level measurement error in robust mixture clustering of replicated microarray gene expression.Stat Appl Genet Mol Biol. 2010;9:Article42. doi: 10.2202/1544-6115.1600. Epub 2010 Dec 9. Stat Appl Genet Mol Biol. 2010. PMID: 21194414
-
From microarray to biological networks: Analysis of gene expression profiles.Methods Mol Biol. 2006;316:35-48. doi: 10.1385/1-59259-964-8:35. Methods Mol Biol. 2006. PMID: 16671399 Review.
-
Gene expression data analysis.Microbes Infect. 2001 Aug;3(10):823-9. doi: 10.1016/s1286-4579(01)01440-x. Microbes Infect. 2001. PMID: 11580977 Review.
Cited by
-
LARGE COVARIANCE ESTIMATION THROUGH ELLIPTICAL FACTOR MODELS.Ann Stat. 2018 Aug;46(4):1383-1414. doi: 10.1214/17-AOS1588. Epub 2018 Jun 27. Ann Stat. 2018. PMID: 30214095 Free PMC article.
-
The Decomposition and Forecasting of Mutual Investment Funds Using Singular Spectrum Analysis.Entropy (Basel). 2020 Jan 9;22(1):83. doi: 10.3390/e22010083. Entropy (Basel). 2020. PMID: 33285858 Free PMC article.
-
Poisson factor models with applications to non-normalized microRNA profiling.Bioinformatics. 2013 May 1;29(9):1105-11. doi: 10.1093/bioinformatics/btt091. Epub 2013 Feb 21. Bioinformatics. 2013. PMID: 23428639 Free PMC article.
-
Robust methods for population stratification in genome wide association studies.BMC Bioinformatics. 2013 Apr 19;14:132. doi: 10.1186/1471-2105-14-132. BMC Bioinformatics. 2013. PMID: 23601181 Free PMC article.
-
Identification of diagnostic biomarkers for infection in premature neonates.Mol Cell Proteomics. 2008 Oct;7(10):1863-75. doi: 10.1074/mcp.M800175-MCP200. Epub 2008 Jul 13. Mol Cell Proteomics. 2008. PMID: 18622029 Free PMC article.
References
-
- Healy, M. J. R. (1986) Matrices for Statisticians (Clarendon, Oxford), pp. 64-66.
-
- Gabriel, K. R. & Zamir, S. (1979) Technometrics 21, 489-498.
-
- Croux, C., Filzmoser, P., Pison, G. & Rousseeum, P. J. (2002) Stat. Comput. 13, 23-36.
-
- Ukkelberg, A. & Borgen, O. (1993) Anal. Chim. Acta 277, 489-494.
-
- Venter, J. H. & Steel, S. J. (1996) Comput. Stat. Data Anal. 22, 481-504.
MeSH terms
LinkOut - more resources
Full Text Sources
Other Literature Sources
Medical
