

Trp-cage: folding free energy landscape in explicit water
- PMID: 14581616
- PMCID: PMC263783
- DOI: 10.1073/pnas.2233312100
Trp-cage: folding free energy landscape in explicit water
Abstract
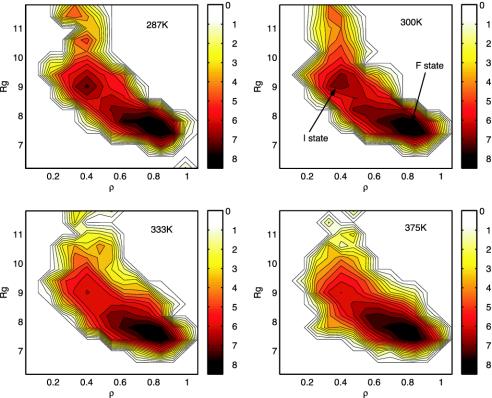
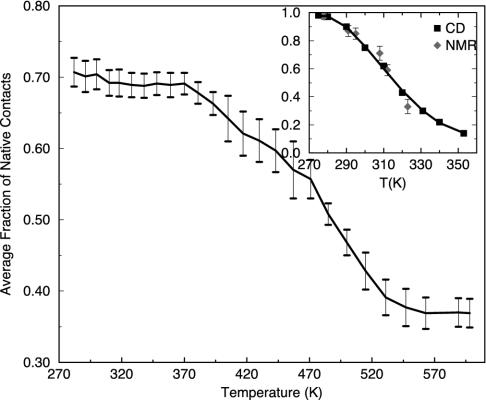
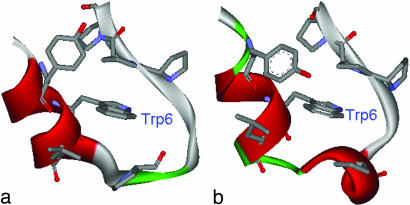
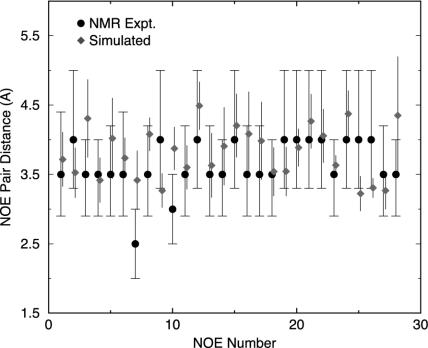
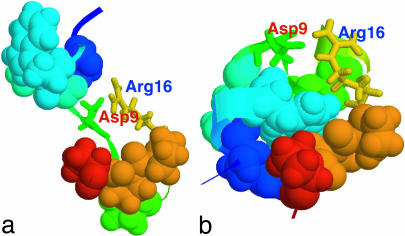
Trp-cage is a 20-residue miniprotein, which is believed to be the fastest folder known so far. In this study, the folding free energy landscape of Trp-cage has been explored in explicit solvent by using an OPLSAA force field with periodic boundary condition. A highly parallel replica exchange molecular dynamics method is used for the conformation space sampling, with the help of a recently developed efficient molecular dynamics algorithm P3ME/RESPA (particle-particle particle-mesh Ewald/reference system propagator algorithm). A two-step folding mechanism is proposed that involves an intermediate state where two correctly formed partial hydrophobic cores are separated by an essential salt-bridge between residues Asp-9 and Arg-16 near the center of the peptide. This metastable intermediate state provides an explanation for the superfast folding process. The free energy landscape is found to be rugged at low temperatures, and then becomes smooth and funnel-like above 340 K. The lowest free energy structure at 300 K is only 1.50 A Calpha-RMSD (Calpha-rms deviation) from the NMR structures. The simulated nuclear Overhauser effect pair distances are in excellent agreement with the raw NMR data. The temperature dependence of the Trp-cage population, however, is found to be significantly different from experiment, with a much higher melting transition temperature above 400 K (experimental 315 K), indicating that the current force fields, parameterized at room temperature, need to be improved to correctly predict the temperature dependence.
Figures
Similar articles
-
Exploring the protein folding free energy landscape: coupling replica exchange method with P3ME/RESPA algorithm.J Mol Graph Model. 2004 May;22(5):451-63. doi: 10.1016/j.jmgm.2003.12.011. J Mol Graph Model. 2004. PMID: 15099840
-
Understanding folding and design: replica-exchange simulations of "Trp-cage" miniproteins.Proc Natl Acad Sci U S A. 2003 Jun 24;100(13):7587-92. doi: 10.1073/pnas.1330954100. Epub 2003 Jun 13. Proc Natl Acad Sci U S A. 2003. PMID: 12808142 Free PMC article.
-
The free energy landscape for beta hairpin folding in explicit water.Proc Natl Acad Sci U S A. 2001 Dec 18;98(26):14931-6. doi: 10.1073/pnas.201543998. Proc Natl Acad Sci U S A. 2001. PMID: 11752441 Free PMC article.
-
The folding, stability and conformational dynamics of beta-barrel fluorescent proteins.Chem Soc Rev. 2009 Oct;38(10):2951-65. doi: 10.1039/b908170b. Epub 2009 Sep 4. Chem Soc Rev. 2009. PMID: 19771338 Review.
-
Combining experiment and simulation in protein folding: closing the gap for small model systems.Curr Opin Struct Biol. 2008 Feb;18(1):4-9. doi: 10.1016/j.sbi.2007.11.007. Epub 2008 Feb 1. Curr Opin Struct Biol. 2008. PMID: 18242977 Free PMC article. Review.
Cited by
-
Correlation analysis for heat denaturation of Trp-cage miniprotein with explicit solvent.Protein Sci. 2016 Jan;25(1):56-66. doi: 10.1002/pro.2754. Epub 2015 Aug 6. Protein Sci. 2016. PMID: 26189564 Free PMC article.
-
Local sequence alignments statistics: deviations from Gumbel statistics in the rare-event tail.Algorithms Mol Biol. 2007 Jul 11;2:9. doi: 10.1186/1748-7188-2-9. Algorithms Mol Biol. 2007. PMID: 17625018 Free PMC article.
-
An In Silico study of TiO2 nanoparticles interaction with twenty standard amino acids in aqueous solution.Sci Rep. 2016 Nov 24;6:37761. doi: 10.1038/srep37761. Sci Rep. 2016. PMID: 27883086 Free PMC article.
-
Replica exchange with solute tempering: efficiency in large scale systems.J Phys Chem B. 2007 May 17;111(19):5405-10. doi: 10.1021/jp068826w. Epub 2007 Apr 17. J Phys Chem B. 2007. PMID: 17439169 Free PMC article.
-
A quadrupole/time-of-flight mass spectrometry study of Trp-cage's conformation.J Am Soc Mass Spectrom. 2007 Feb;18(2):195-200. doi: 10.1016/j.jasms.2006.09.001. Epub 2006 Oct 24. J Am Soc Mass Spectrom. 2007. PMID: 17067814
References
-
- McCammon, J. A. & Wolynes P. G., eds. (2002) Current Opinion in Structural Biology (Curr. Biol. Press, London).
-
- Zhou, Y. & Karplus, M. (199) Nature 401, 400-402. - PubMed
-
- Snow, C. D., Nguyen, H., Pande, V. S. & Gruebele, M. (2002) Nature 420, 102-104. - PubMed
-
- Neidigh J. W., Fesinmeyer R. M. & Andersen N. H. (2002) Nat. Struct. Biol. 9, 425-430. - PubMed
MeSH terms
Substances
LinkOut - more resources
Full Text Sources
