. 2003 Nov 11;100(23):13308-13.
doi: 10.1073/pnas.2233244100. Epub 2003 Oct 28.

Visualizing the distribution and transport of mRNAs in living cells

Affiliations

Visualizing the distribution and transport of mRNAs in living cells

Diana P Bratu et al. Proc Natl Acad Sci U S A. .

Abstract

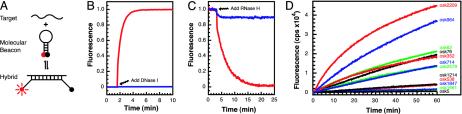
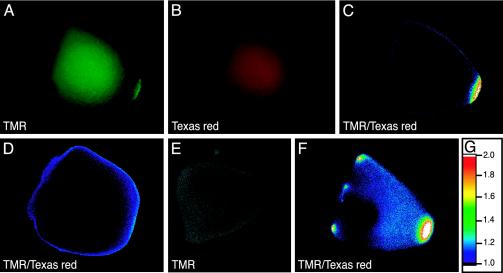
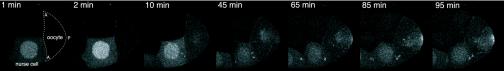
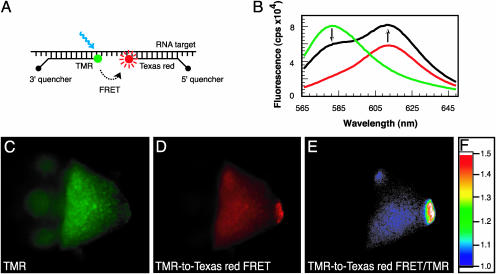
We have visualized the movements of native mRNAs in living cells. Using nuclease-resistant molecular beacons, we imaged the transport and localization of oskar mRNA in Drosophila melanogaster oocytes. When the localization pattern was altered by genetic manipulation of the mRNA's 3' untranslated region, or by chemical perturbation of the intracellular tubulin network, the distribution of the fluorescence signals changed accordingly. We tracked the migration of oskar mRNA in real time, from the nurse cells where it is produced to the posterior cortex of the oocyte where it is localized. Our observations reveal the presence of a transient, and heretofore elusive, stage in the transport of oskar mRNA. Direct visualization of specific mRNAs in living cells with molecular beacons will accelerate studies of intracellular RNA trafficking and localization, just as the use of green fluorescent protein has stimulated the study of specific proteins in vivo.


Figures

Fig. 1.
Fig. 1.
Design of the molecular beacon. (A) Principle of operation. When these probes hybridize to their mRNA targets, the fluorescence of an internally quenched fluorophore is restored, enabling target detection. (B and C) Substitution of 2′-O-methylribonucleotides for deoxyribonucleotides within the backbone of molecular beacons renders them resistant to cleavage by DNase I, and their hybrids with RNA become refractory to digestion by ribonuclease H. The fluorescence of molecular beacons possessing deoxyribonucleotide backbones (osk76-DNA) is shown in red, and the fluorescence of molecular beacons possessing 2′-O-methylribonucleotide backbones (osk76) is shown in blue. (D) Selection of molecular beacon-accessible target regions in oskar mRNA. The most accessible target sequences induce the fastest increase in fluorescence. The location of molecular beacon target sites within the predicted secondary structure of oskar mRNA is shown in Fig. 5, and the sequences of the molecular beacons specific for these sites are listed in Table 1.
Fig. 2.
Fig. 2.
Imaging the distribution of oskar mRNA in Drosophila oocytes. A mixture containing a TMR-labeled molecular beacon that is specific for oskar mRNA (osk76) and a Texas red-labeled control molecular beacon that cannot bind to oskar mRNA (mismatched-osk76) was microinjected into stage 9 - 10 oocytes and imaged after 15 min. (A-C) A microinjected oocyte obtained from wild-type flies was imaged in the fluorescence emission range of TMR (A), in the fluorescence emission range of Texas red (B), and by ratio imaging (C). Ratio imaging was performed by dividing the TMR emission intensity by the Texas red emission intensity at every pixel in the image. (D) Ratio image of a microinjected oocyte obtained from a wild-type mother that was fed a microtubule depolymerizing agent to disrupt oskar mRNA translocation. (E) A microinjected oocyte that lacked a functional heavy chain component of the kinesin I motor protein, and was therefore unable to transport oskar mRNA to the posterior cortex, was imaged in the emission range of TMR with a confocal fluorescence microscope. (F) Ratio image of a microinjected oocyte from a transgenic fly possessing one copy of the oskar gene containing the 3′ UTR of bicoid mRNA in place of its own 3′ UTR, and another copy of the oskar gene containing its natural 3′ UTR. (G) Table of color codes used for depicting the ratios obtained in generating images C, D, and F.
Fig. 4.
Fig. 4.
Direct visualization of the transport of native oskar mRNA from a nurse cell to the posterior cortex of the oocyte. A TMR-labeled molecular beacon specific for oskar mRNA was injected into the cytoplasm of a nurse cell proximal to the oocyte. Images were acquired every 10 s over a period of 90 min, beginning immediately after microinjection, by using a confocal fluorescence microscope (the entire time course is shown in Movie 1). The anterior cortex (A) and the posterior cortex (P) of the oocyte and the location of the microinjected nurse cell are identified in the earliest image.
Fig. 3.
Fig. 3.
Use of binary molecular beacons to confirm that signals at the posterior pole of oocytes stem from hybridization to oskar mRNA. (A) The fluorophores of two appropriately designed molecular beacons can undergo FRET. Binding of differently colored molecular beacons to nearly adjacent positions on a target mRNA enables their two fluorophores to interact by FRET, which generates a uniquely detectable signal, whereas the nonspecific association of these molecular beacons with cellular components that elicit fluorescence does not place the pair of probes in a position that enables FRET to occur. (B) Detection of oskar mRNA in vitro with FRET, by using molecular beacon osk62 (labeled at its 5′ end with TMR) and molecular beacon osk87 (labeled at its 3′ end with Texas red), both of which bind to oskar mRNA at locations seven nucleotides apart from each other. The fluorescence spectrum of osk62 bound alone to oskar mRNA is shown by the green curve, and the fluorescence spectrum of osk87 bound alone to oskar mRNA is shown by the red curve. When they both bind to oskar mRNA, TMR fluorescence is depressed and Texas red fluorescence is elevated (black curve). (C and D) Imaging a wild-type oocyte 30 min after microinjection of a mixture of osk62 and osk87, by using either a filter set designed to stimulate the fluorescence of TMR and record the emission of TMR (C)ora filter set designed to highlight the FRET signal (D), which illuminates the specimen in the optimal excitation range of TMR and records the image in the optimal emission range of Texas red. (E) A ratio image, generated by dividing the intensity of the FRET signal in image D by the intensity of TMR fluorescence in image C at every pixel in the image. (F) Table of color codes used for depicting the ratios obtained in generating image E.

References

    1. Tekotte, H. & Davis, I. (2002) Trends Genet. 18, 636-642. - PubMed
    1. Jansen, R. P. (2001) Nat. Rev. Mol. Biol. 2, 247-256. - PubMed
    1. Dubowy, J. & Macdonald, P. M. (1998) Mech. Dev. 70, 193-195. - PubMed
    1. Berleth, T., Burri, M., Thoma, G., Bopp, D., Richstein, S., Frigerio, G., Noll, M. & Nusslein-Volhard, C. (1988) EMBO J. 7, 1749-1756. - PMC - PubMed
    1. Kim-Ha, J., Smith, J. L. & Macdonald, P. M. (1991) Cell 66, 23-35. - PubMed

Publication types

LinkOut - more resources