. 2003 Nov;23(22):8124-36.
doi: 10.1128/MCB.23.22.8124-8136.2003.

Biochemical characterization of the Ran-RanBP1-RanGAP system: are RanBP proteins and the acidic tail of RanGAP required for the Ran-RanGAP GTPase reaction?

Affiliations

Biochemical characterization of the Ran-RanBP1-RanGAP system: are RanBP proteins and the acidic tail of RanGAP required for the Ran-RanGAP GTPase reaction?

Michael J Seewald et al. Mol Cell Biol. 2003 Nov.

Abstract

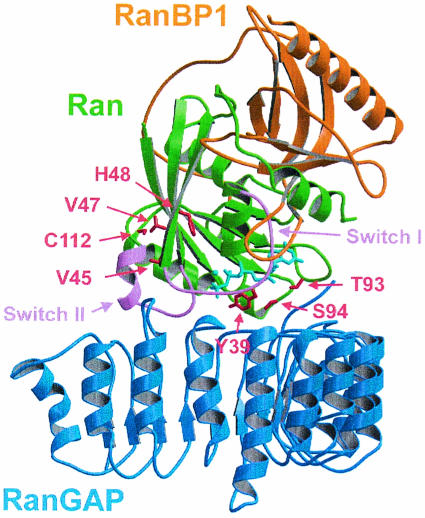
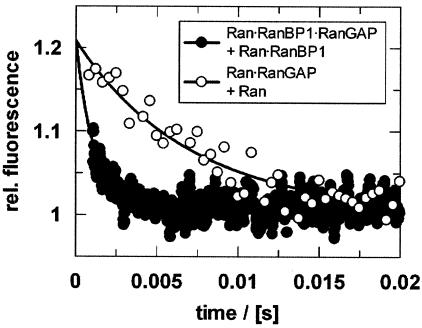
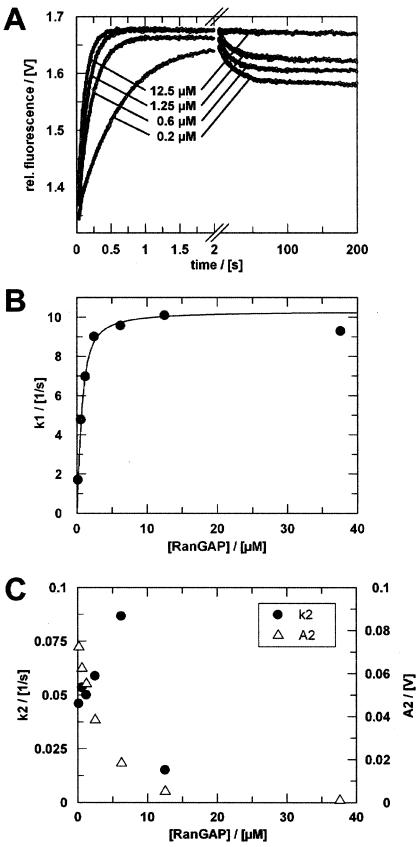
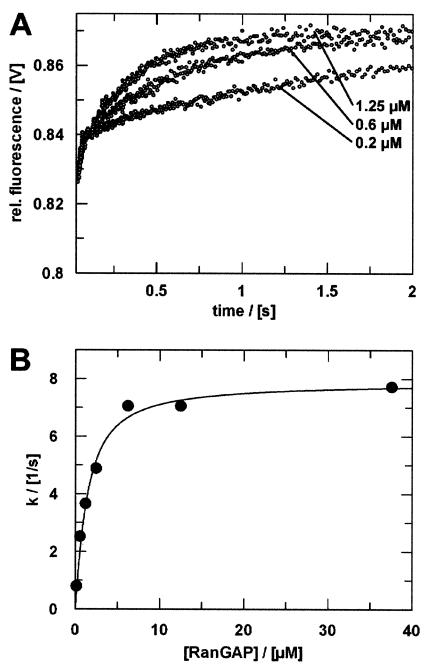
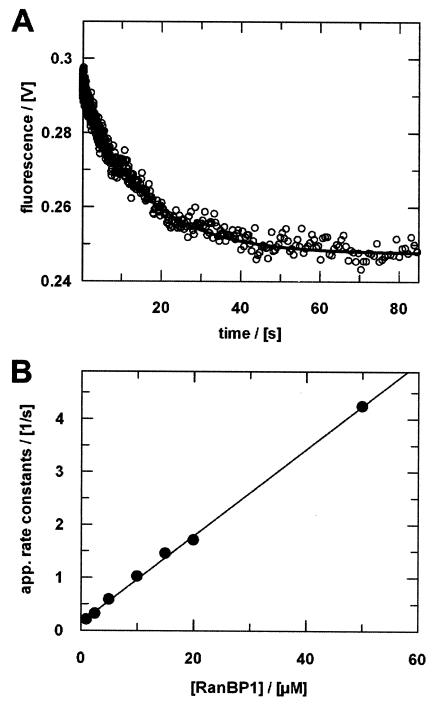
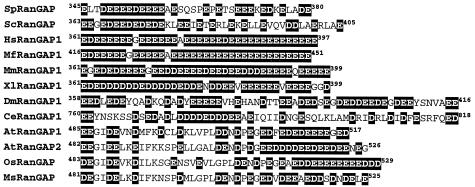
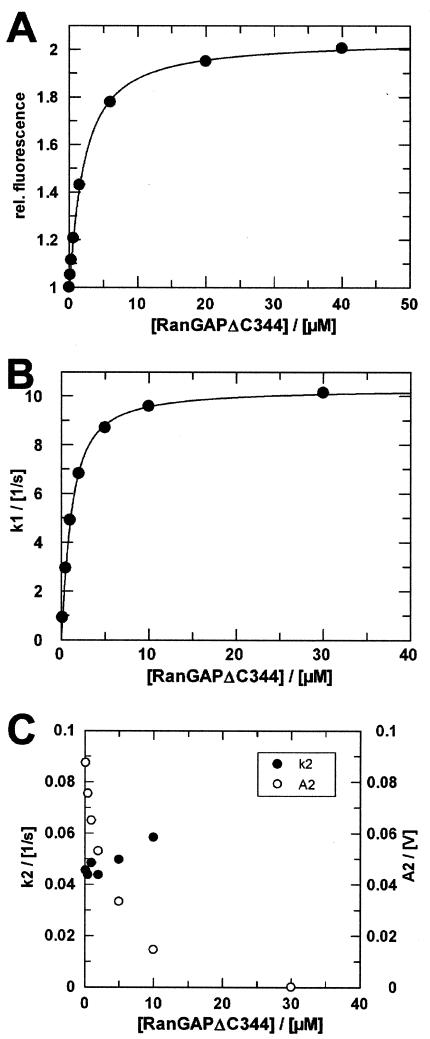
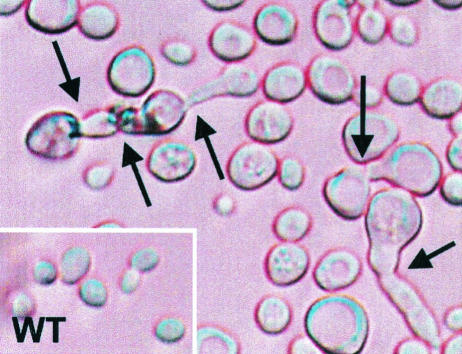
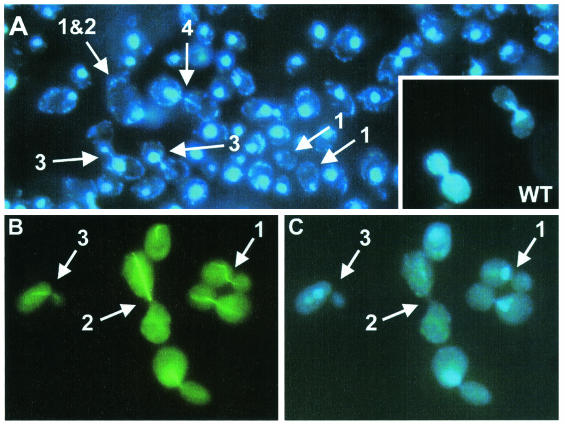
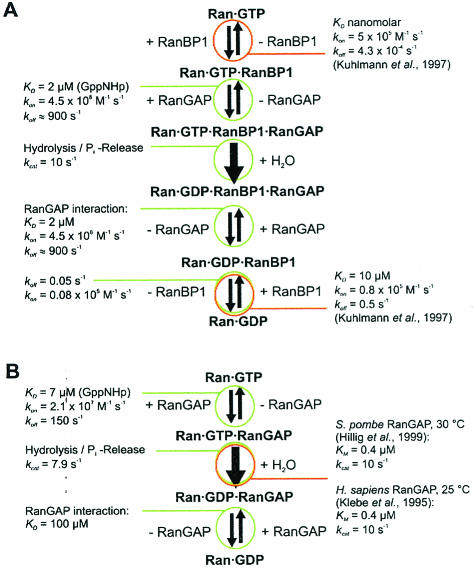
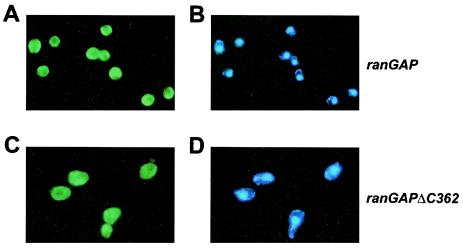
RanBP type proteins have been reported to increase the catalytic efficiency of the RanGAP-mediated GTPase reaction on Ran. Since the structure of the Ran-RanBP1-RanGAP complex showed RanBP1 to be located away from the active site, we reinvestigated the reaction using fluorescence spectroscopy under pre-steady-state conditions. We can show that RanBP1 indeed does not influence the rate-limiting step of the reaction, which is the cleavage of GTP and/or the release of product P(i). It does, however, influence the dynamics of the Ran-RanGAP interaction, its most dramatic effect being the 20-fold stimulation of the already very fast association reaction such that it is under diffusion control (4.5 x 10(8) M(-1) s(-1)). Having established a valuable kinetic system for the interaction analysis, we also found, in contrast to previous findings, that the highly conserved acidic C-terminal end of RanGAP is not required for the switch-off reaction. Rather, genetic experiments in Saccharomyces cerevisiae demonstrate a profound effect of the acidic tail on microtubule organization during mitosis. We propose that the acidic tail of RanGAP is required for a process during mitosis.


Figures

FIG. 1.
FIG. 1.
Structure of the Ran-GppNHp-RanBP1-RanGAP complex (66) indicating the positions of residues of Ran (green) selected for site-directed mutagenesis, the switch regions (pink), nucleotide (cyan), and binding partners RanBP1 (orange) and RanGAP (blue). The indicated amino acids were mutated to cysteine, C112 was mutated to Ser, and Y39, which is required for catalysis, was not mutated. The figure was prepared with MOLSCRIPT (39) and RASTER3D (49).
FIG. 2.
FIG. 2.
Fluorescence emission spectra of Ran47. Spectra were recorded at 20°C in 0.1 M Tris-HCl (pH 7.5), 2 mM DTE, 2 mM MgCl2, and 5% glycerol and were normalized to the emission maximum of 0.5 μM Ran47-GppNHp. The excitation wavelength was 350 nm, with 5-nm slits. The emission wavelength was 380 to 600 nm, integrated in steps of 1 nm with a 1-s integration time and 5-nm slits. Starting with Ran (black curve), interaction partners were added (green curve, RanGAP; brown curve, RanBP1) and difference spectra were calculated (red curve, after the addition of RanBP1; light green, after the addition of RanGAP; blue curve, difference spectra calculated from the curves for Ran-GppNHp and Ran-GDP). The following were added to 0.5 μM Ran-GppNHp (A and B) or 0.5 μM Ran-GDP (C and D): 1 μM (A) or 10 μM (C) RanBP1 and 10 μM RanGAP (A to D) (final concentrations).
FIG. 3.
FIG. 3.
Fluorescence emission spectra of Ran94. Spectra were normalized to the emission maximum of 0.5 μM Ran94-GppNHp. For conditions and protein concentrations, see the legend for Fig. 2.
FIG. 4.
FIG. 4.
Titrations of Ran with RanGAP. (A) Ran94-GppNHp (0.5 μM) was titrated in the absence (○) or presence (•) of 1 μM RanBP1 with Schizosaccharomyces pombe RanGAP (Kd, 7 or 2 μM, respectively). (B) Ran94-GDP (0.75 μM) was titrated in the absence (○) or presence (•) of 40 μM RanBP1 with Schizosaccharomyces pombe RanGAP (Kd, ∼100 or 2 μM, respectively). (C) Salt dependence of the Ran-RanGAP interaction. Ran94-GppNHp-RanBP1 (0.75 μM) was titrated at 8°C with Schizosaccharomyces pombe RanGAP in buffer (as described above) containing 0 M NaCl (•) (Kd, 1 μM), 250 mM NaCl (□) (Kd, 220 μM), or 500 mM NaCl (▵) (Kd, ≥1 mM). Fluorescence spectra were recorded, and calculation of Kd values was done as described in Materials and Methods. Note that the affinities (Kd) of RanBP1 for Ran-GppNHp and Ran-GDP are 1 nM and 10 μM, respectively (40).
FIG. 5.
FIG. 5.
Dissociation of RanGAP from the binary Ran-GppNHp-RanGAP (○) or the ternary Ran-GppNHp-RanBP1-RanGAP (•) complex after adding excess Ran or Ran-RanBP1 complex, respectively. To observe the Ran-RanGAP dissociation, 4 μM Ran94-GppNHp-RanGAP was mixed at a 1:1 ratio (vol/vol) with 80 μM Ran-GppNHp (○) (koff = 150 s−1). To determine the dissociation constant in the presence of RanBP1, 1.5 μM Ran94-GppNHp-RanBP1-RanGAP was mixed at a 1:1 ratio (vol/vol) with 80 μM Ran-GppNHp-RanBP1 (•) (koff = 880 s−1). Measurements were performed by stopped-flow experiments and analyzed as described in Materials and Methods.
FIG. 6.
FIG. 6.
Single-turnover measurements of RanGAP-catalyzed hydrolysis of Ran-GTP in the presence of RanBP1. (A) Ran47-GTP-RanBP1 (1.5 μM) was mixed with different concentrations of RanGAP (only four curves are shown) in the stopped-flow apparatus. Fluorescence transients were fitted as double exponentials. (B) Rate constants (•) of the first phase plotted against RanGAP concentration. Assuming a simple saturation model (16) and given that koffkcat, observed rate constants can be fitted to a quadratic equation (Kdapp = 0.3 μM; kcat = 10.3 s−1). (C) Rate constants (•) and amplitudes (▵) of the second phase (k2 ≈ 0.05 s−1) plotted against RanGAP concentration. Measurements were performed and analyzed as described in Materials and Methods.
FIG. 7.
FIG. 7.
RanGAP-catalyzed hydrolysis of Ran-GTP. (A) Ran47-GTP (1.5 μM) was mixed at a 1:1 ratio (vol/vol) with RanGAP in the stopped-flow apparatus (only three curves are shown). The fluorescence transients were fitted as single exponentials. (B) Plot of rate constants (•) versus [RanGAP]. Assuming a simple saturation model (16) and given that koffkcat, the observed rate constants can be fitted to a quadratic equation (Kd = 1.0 μM; kcat = 7.9 s−1). Measurements were performed and analyzed as described in Materials and Methods.
FIG. 8.
FIG. 8.
Ran-RanBP1 interaction. (A) Dissociation of the Ran-GDP-RanBP1 complex after adding excess Ran-GDP. Ran94-GDP-RanBP1 (6 μM) was mixed at a 1:1 ratio (vol/vol) with 250 μM RanBP1 in the stopped-flow apparatus. Fitting the curve to a single exponential yields a dissociation rate (koff) of 0.06 s−1. (B) Association of Ran-GDP and RanBP1. Ran94-GDP (1 μM final concentration) was mixed with increasing concentrations of RanBP1 in the stopped-flow apparatus. Kinetics were analyzed assuming pseudo-first-order conditions. The apparent rate constants were plotted against [RanBP1] to yield the results kon = 0.08 μM−1 s−1 (slope) and koff = 0.1 s−1 (intercept). Measurements were performed and analyzed as described in Materials and Methods.
FIG. 9.
FIG. 9.
Acidic carboxy-terminal region of RanGAP proteins. Aspartic acid and glutamic acid residues are highlighted (black). The first two letters of the sequence names indicate the organism as follows: Sp, Schizosaccharomyces pombe; Sc, Saccharomyces cerevisiae; Hs, Homo sapiens; Mf, Macaca fascicularis; Mm, Mus musculus; Xl, Xenopus laevis; Dm, Drosophila melanogaster; Ce, Caenorhabditis elegans; At, Arabidopsis thaliana; Ms, Medicago sativa; Os, Oryza sativa.
FIG. 10.
FIG. 10.
Titrations of Ran with RanGAPΔC344. (A) Ran94-GppNHp-RanBP1 (0.5 μM) was titrated with Schizosaccharomyces pombe RanGAPΔC344 (Kd = 1.7 μM). Buffer conditions and instrument settings were as described for Fig. 4B and C. Single-turnover measurements of RanGAPΔC344 catalyzed hydrolysis of Ran-GTP in the presence of RanBP1. Ran47-GTP-RanBP1 (1.5 μM) was mixed with different concentrations of RanGAPΔC344 in the stopped-flow apparatus. Fluorescence transients were fitted as double exponentials. (B) Rate constants (•) of the first phase plotted against RanGAP concentration. Assuming a simple saturation model and assuming that koffkcat, observed rate constants can be fitted to a quadratic equation (Kdapp = 0.5 μM; kcat = 10.5 s−1). (C) Rate constants (•) and amplitudes (○) of the second phase plotted against RanGAP concentration (k2 ≈ 0.05 s−1). Measurements were performed and analyzed as described in Materials and Methods.
FIG. 11.
FIG. 11.
Haploid cells of Saccharomyces cerevisiae FY1679 rangapΔC362 under a light microscope (100-fold primary magnification). Arrows indicate mutant cells that were unable to complete mitosis. WT, wild type.
FIG. 12.
FIG. 12.
Chromatin structure. (A) Haploid Saccharomyces cerevisiae FY1679 rangapΔC362 cells stained with DAPI. Numbered arrows denote different phenotypes as follows: 1, cell without nucleus; 2, very large cell; 3, mitotic cell which apparently has arrested in mitosis; 4, mitotic cell which failed in separating the chromatin evenly between the mother and bud cells. For comparison, dividing wild-type cells (WT) are shown in the lower right corner. Pictures were taken with an Axiophot fluorescence microscope (Zeiss) at 40-fold primary magnification. (B and C) α-Tubulin and chromatin structure. In haploid Saccharomyces cerevisiae FY1679 rangapΔC362 cells, α-tubulin was stained with antibodies (fluorescein isothiocyanate-labeled secondary antibody) (B) and chromatin was stained with DAPI (C). Numbered arrows denote different phenotypes as follows: 1, wild type-like cell division; 2 and 3, malformed microtubule and nucleus structures. Pictures were taken with an Axiophot fluorescence microscope (Zeiss) at 100-fold primary magnification.
FIG. 13.
FIG. 13.
Kinetic models for RanGAP-catalyzed Ran-GTP hydrolysis and corresponding rate and equilibrium constants. (A) With RanBP1. (B) Without RanBP1. From the data presented here, it cannot be determined whether the rate limiting step kcat denotes the actual cleavage reaction or the Pi release step and whether or not Pi is released before or after RanGAP dissociation.
FIG. 14.
FIG. 14.
Localization of RanGAP (A and C) or chromatin (B and D) in either Saccharomyces cerevisiae wild-type (A and B) or rangapΔC362 (C and D) cells. RanGAP staining was performed using primary anti-RanGAP antibodies and secondary fluorescein isothiocyanate-labeled antibodies. Chromatin was stained with DAPI.

Similar articles

Cited by

References

    1. Agatep, R., R. D. Kirkpatrick, D. L. Parchaliuk, R. A. Woods, and R. D. Gietz. 1998. Transformation of Saccharomyces cerevisiae by the lithium acetate/single-stranded carrier DNA/polyethylene glycol (LiAc/ss-DNA/PEG) protocol. Tech. Tips Online 1:P01525. [Online.] http://research.bmn.com/tto.
    1. Ahmadian, M. R., U. Hoffmann, R. S. Goody, and A. Wittinghofer. 1997. Individual rate constants for the interaction of Ras proteins with GTPase-activating proteins determined by fluorescence spectroscopy. Biochemistry 36:4535-4541. - PubMed
    1. Ahmadian, M. R., R. Mittal, A. Hall, and A. Wittinghofer. 1997. Aluminum fluoride associates with the small guanine nucleotide binding proteins. FEBS Lett. 408:315-318. - PubMed
    1. Ahmadian, M. R., P. Stege, K. Scheffzek, and A. Wittinghofer. 1997. Confirmation of the arginine-finger hypothesis for the GAP-stimulated GTP-hydrolysis reaction of Ras. Nat. Struct. Biol. 4:686-689. - PubMed
    1. Allin, C., M. R. Ahmadian, A. Wittinghofer, and K. Gerwert. 2001. Monitoring the GAP catalyzed H-Ras GTPase reaction at atomic resolution in real time. Proc. Natl. Acad. Sci. USA 98:7754-7759. - PMC - PubMed

Publication types

MeSH terms