. 2003 Oct 29;23(30):9761-9.
doi: 10.1523/JNEUROSCI.23-30-09761.2003.

Gamma oscillations induced by kainate receptor activation in the entorhinal cortex in vitro

Affiliations

Gamma oscillations induced by kainate receptor activation in the entorhinal cortex in vitro

Mark O Cunningham et al. J Neurosci. .

Abstract

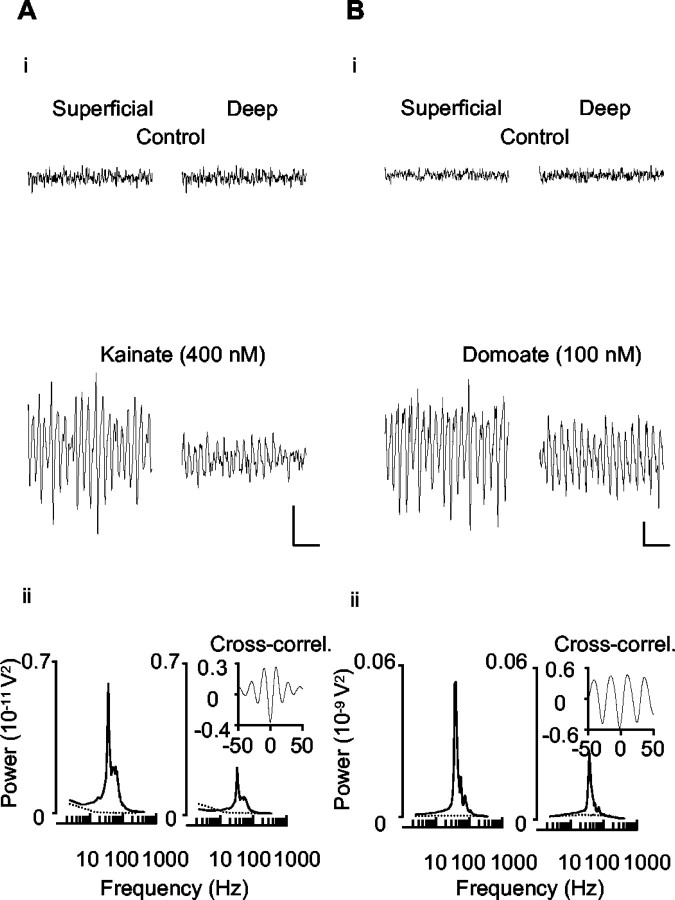
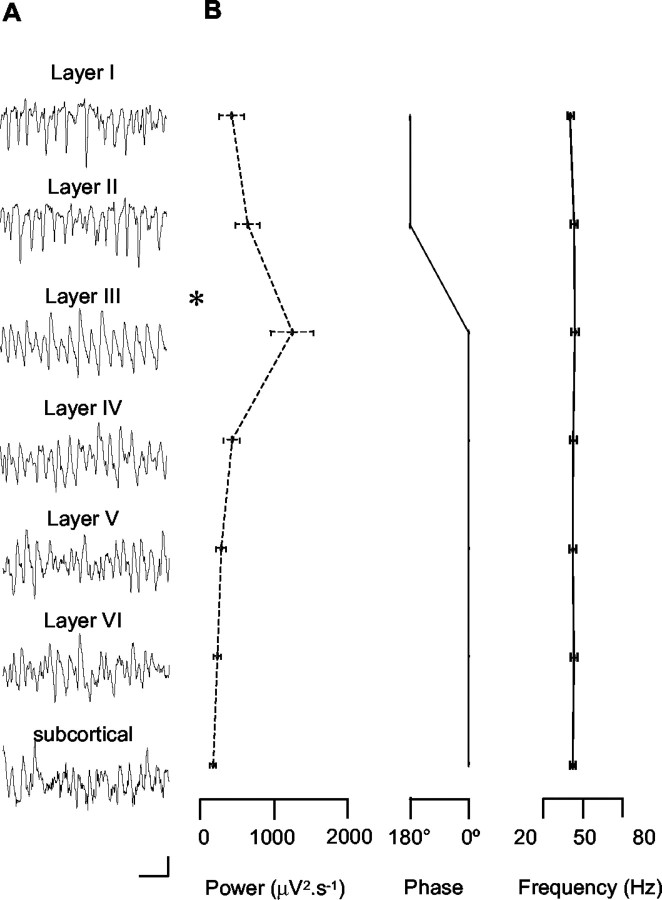
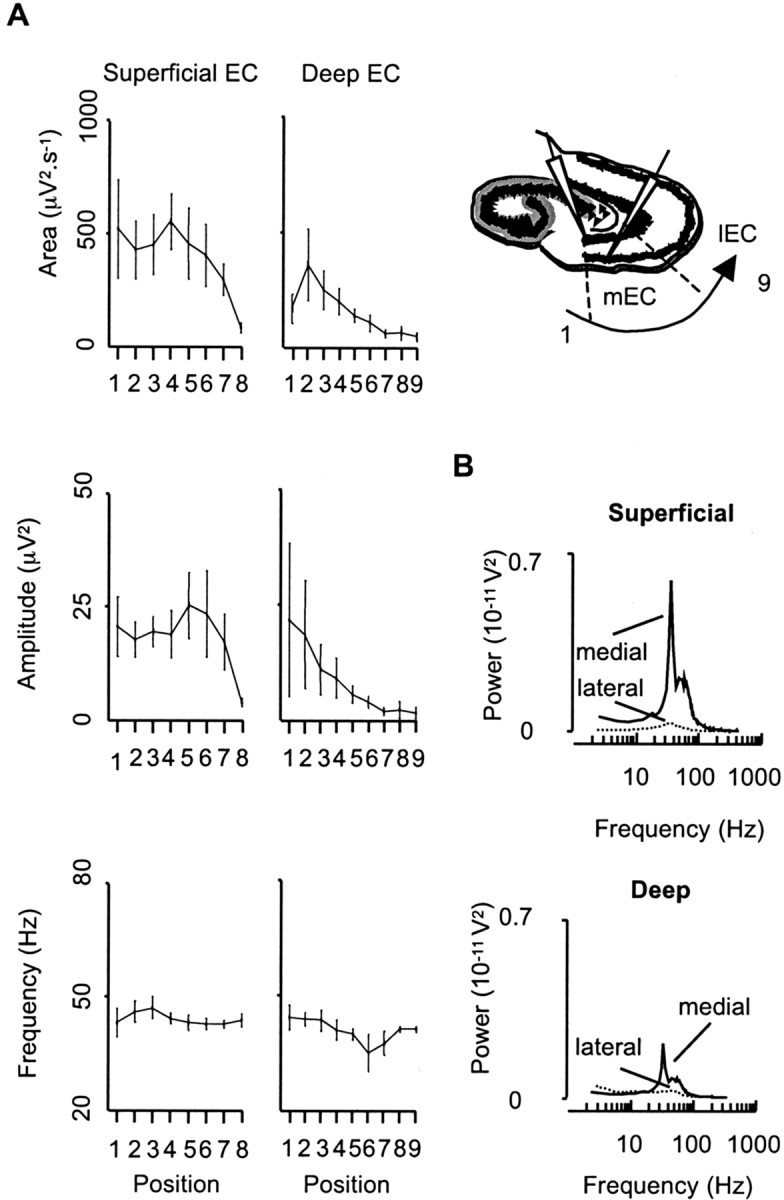
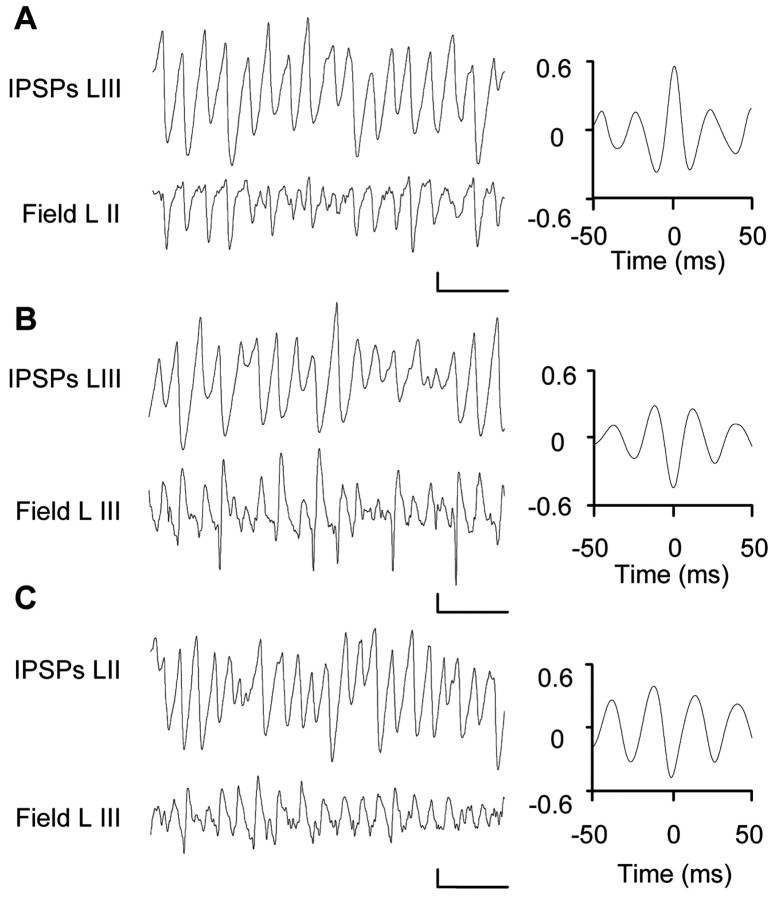
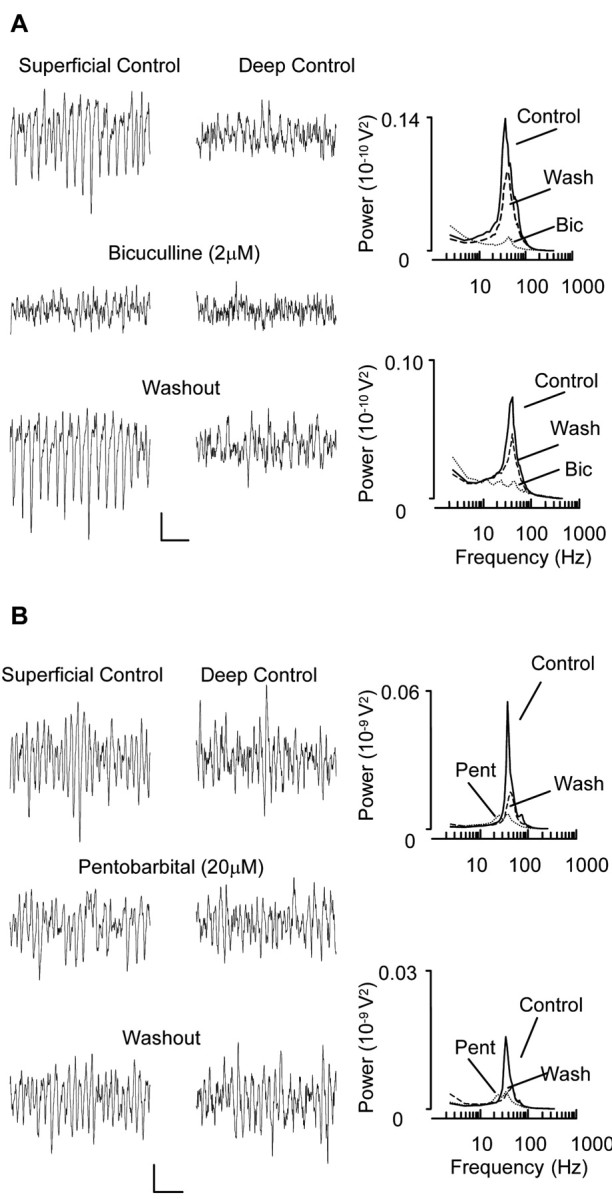
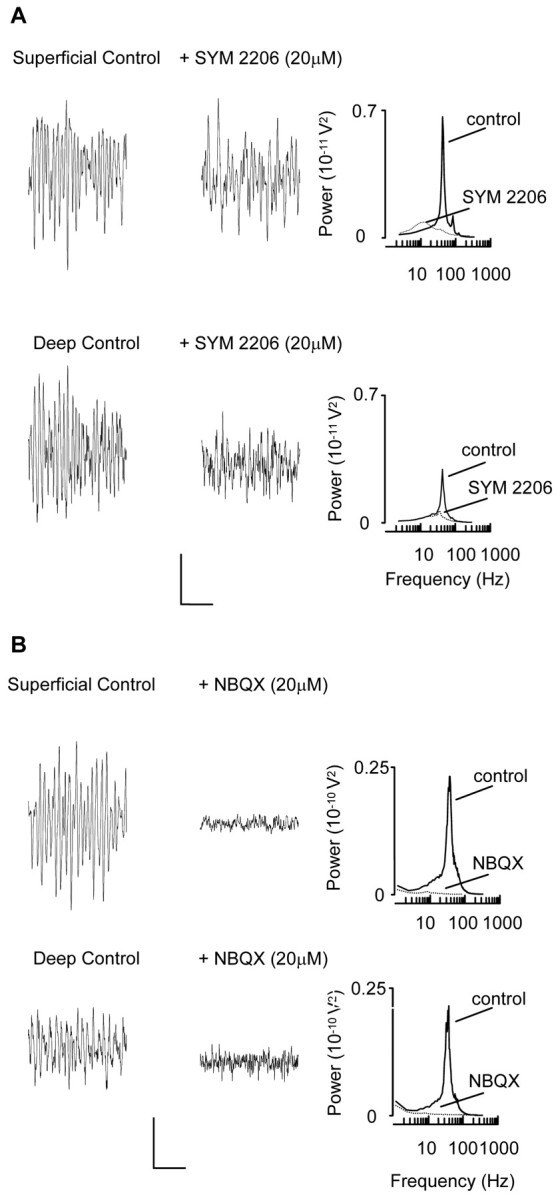
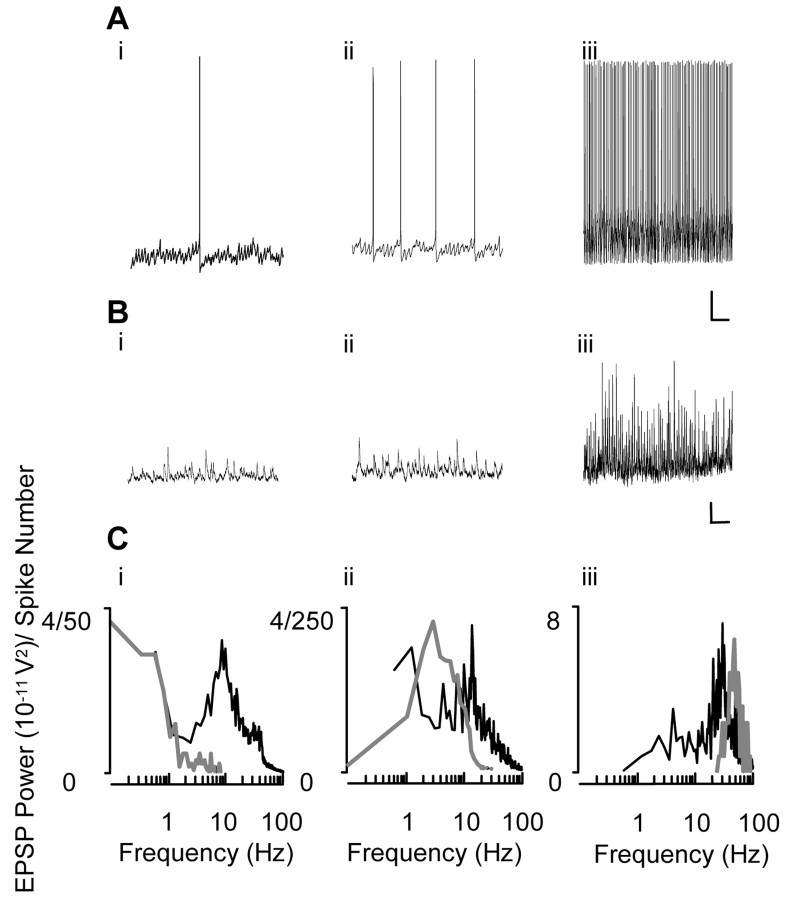
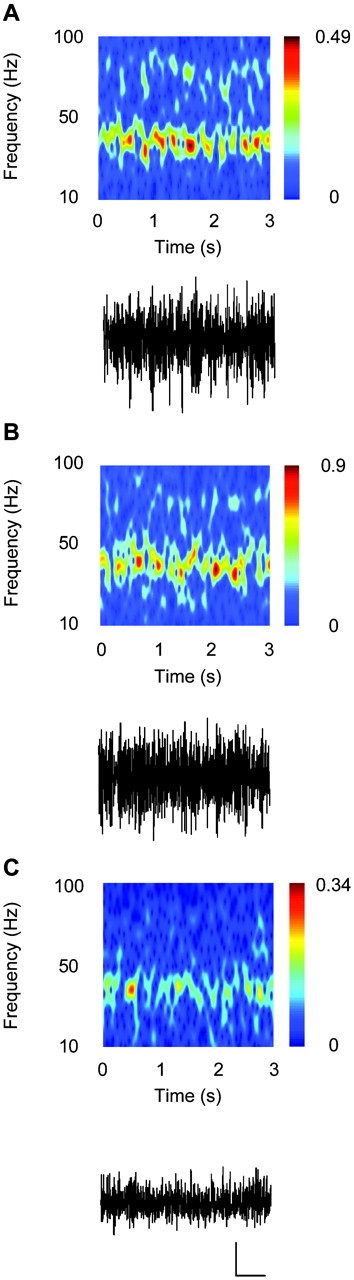
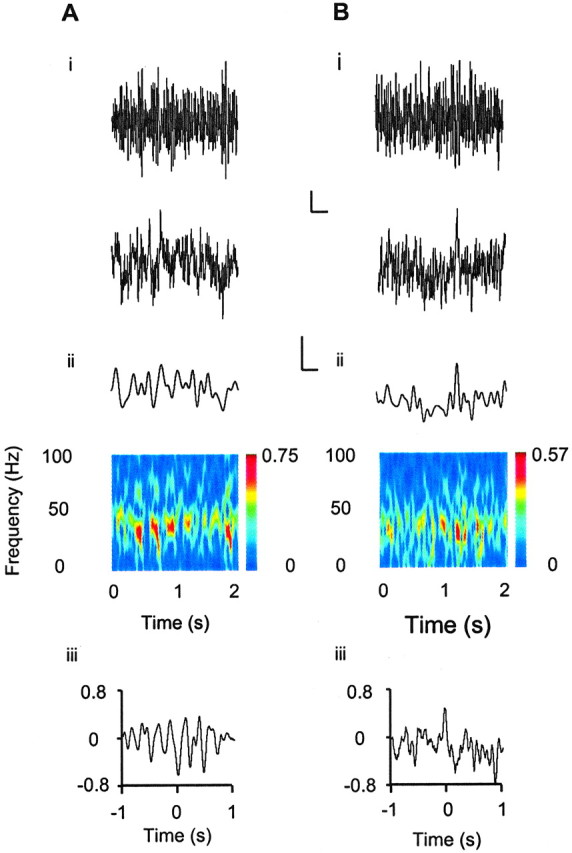
Gamma frequency (30-80 Hz) oscillations are recordable from human and rodent entorhinal cortex. A number of mechanisms used by neuronal networks to generate such oscillations in the hippocampus have been characterized. However, it is as yet unclear as to whether these mechanisms apply to other anatomically disparate brain regions. Here we show that the medial entorhinal cortex (mEC) in isolation in vitro generates gamma frequency oscillations in response to kainate receptor agonists. Oscillations had the same horizontal and laminar spatiotemporal distribution as seen in vivo and in the isolated whole-brain preparation. Oscillations occurred in the absence of input from the hippocampal formation and did not spread to lateral entorhinal regions. Pharmacological similarities existed between oscillations in the hippocampus and mEC in that the latter were also sensitive to GABAA receptor blockade, barbiturates, AMPA receptor blockade, and reduction in gap junctional conductance. Stellate and pyramidal neuron recordings revealed a large GABAergic input consisting of gamma frequency IPSP trains. Fast spiking interneurons in the superficial mEC generated action potentials at gamma frequencies phase locked to the local field. Stellate cells also demonstrated a subthreshold membrane potential oscillation at theta frequencies that was temporally correlated with a theta-frequency modulation in field gamma power. Disruption in this stellate theta frequency oscillation by the hyperpolarisation activated current (Ih) blocker ZD7288 also disrupted theta modulation of field gamma frequency oscillations. We propose that similar cellular and network mechanisms to those seen in the hippocampus generate and modulate persistent gamma oscillations in the entorhinal cortex.


Figures

Figure 1.
Figure 1.
Application of nanomolar concentrations of kainate receptor agonists induced persistent network oscillations in the mEC in vitro. A, Perfusion of kainate (400 nm) generated fast oscillations in the gamma range in the superficial and deep layers of the mEC. Field recordings in Ai demonstrate extracellular recordings from superficial and deep mEC during control and 60 min after the initial application of kainate. Aii, Pooled power spectra (n = 36) for 60 sec epochs of field recording before (dashed line) and after (solid line) kainate application in superficial (left graph) and deep (right graph) mEC. Bi, Addition of the more potent kainate receptor agonist domoate(100nm) also produced fast oscillations in the gamma range. Bii, Pooled power spectra of the signals before and after the application of domoate for superficial and deep layers (n = 5). The inset graphs in both power spectra are cross-correlograms of the superficial and deep traces shown in Ai and Bi. Calibration: Ai, Bi, 50 μV, 100 msec.
Figure 3.
Figure 3.
Laminar profile of gamma activity in the mEC. Profile was obtained by placing one electrode as a reference in the subcortical white matter, and a second electrode was then moved in steps of 100 μm across the mEC laminas. A, Field recordings illustrating gamma activity across all layers of the mEC in one experiment. Note the phase change marked with an asterisk, which occurred in the region between layers II and III. B, Graphs showing pooled data (n = 12) for power, phase, and frequency. Note that layer III exhibits the highest gamma activity and that the phase shift is confirmed; in addition, the frequency of the activity was consistent across all layers. Calibration: A, 50 μV, 50 msec.
Figure 2.
Figure 2.
Lateral profile of gamma activity across superficial and deep layers. Electrode was moved in 50 μm steps from a reference position at the most medial portion of the mEC as illustrated in the diagram. A, Graphs show pooled data (n = 6) for area power (top two graphs) and peak power and frequency (bottom two graphs) across superficial and deep layers of the mEC. As the recording electrode is moved across the lamina to a more lateral position, the power of the activity significantly diminished. lEC, Lateral EC. B, Pooled power spectra (n = 6) illustrating that there was little gamma activity observed in the lateral EC (dashed line) during the application of kainate when compared with the mEC (solid line).
Figure 4.
Figure 4.
Origin of the phase reversal of gamma activity observed in the mEC. A, Top trace, Intracellular recording of rhythmic IPSP activity in a layer III (LIII) pyramidal cell during ongoing gamma oscillation; the cell was depolarized to -40 mV by injection of current through the recording electrode. Bottom trace, Simultaneous extracellular field recording in layer II (LII), i.e., across the phase reversal point illustrated in Figure 4. Graph shows pooled cross-correlogram (n = 6) of concurrently recorded field and intracellular IPSP data. The activity was in-phase. B, IPSPs again recorded from layer III pyramidal neuron (membrane potential, -40 mV), with concurrent field recordings of gamma activity in layer III, i.e., at the same side of the phase reversal point illustrated in Figure 4. Pooled cross-correlogram (n = 6) demonstrates that the IPSPs and field are 180° out of phase. C, IPSPs recorded from a layer II stellate neuron depolarized to -40 mV; the bottom trace is a concurrent field recording from layer III of the mEC. Pooled cross-correlogram (n = 6) shows the activity to be 180° out of phase. Calibration: A–C, top trace, 1 mV, 100 msec; bottom trace, 50 μV, 100 msec.
Figure 5.
Figure 5.
Gamma frequency oscillations in the mEC were critically dependent on GABAA receptor-mediated activity. A, The GABAA receptor antagonist bicuculline (Bic; 2 μm) virtually abolished gamma activity in both superficial and deep layers of the mEC. Activity was restored on washout (Wash) of the drug. Power spectrums located in the right panel illustrate pooled results for both layers (n = 7). B, Traces show control activity from superficial and deep mEC. Application of pentobarbital (Pent; 20μm) caused the power of the activity, as well as a slowing of the frequency of the activity. This reduction in both superficial and deep layers was highly significant (p < 0.001), and the effect was reversible on washout. Power spectra located in the right panel demonstrate pooled power spectra (n = 6). Calibration: A, B, 50 μV, 100 msec.
Figure 6.
Figure 6.
Action of AMPA receptor antagonists on mEC gamma activity. A, Example traces showing the action of SYM 2206 (20 μm) on field gamma oscillations in superficial and deep mEC. Whereas gamma activity was abolished in deep layers, in the superficial layers, addition of the drug abolished activity in the gamma band but revealed a small peak in the theta range. Power spectra illustrate the pooled data from these experiments (n = 3). B, Control field recordings show gamma activity in superficial and deep layers of the mEC before and after addition of NBQX. Pooled power spectra (n = 3) are shown in the right panel. Calibration: A, B, 50 μV, 100 msec.
Figure 7.
Figure 7.
Pattern of action potential generation in three major cell types in the superficial mEC during gamma activity. A, Intracellular recordings from layer II stellate neuron (i), layer III pyramidal neuron (ii), and a layer II fast spiking interneuron (iii) during kainate-induced field gamma frequency oscillations. B, Recordings of EPSP trains in each cell type injected with hyperpolarizing current to keep membrane potential at -70 mV. Examples of such recordings from a layer II stellate, layer III pyramid, and layer II interneuron are illustrated in i–iii. C, Combined action potential frequency histograms and EPSP power spectra illustrate the frequency of action potentials and EPSPs in an example from each cell type. Cell firing frequencies are shown as the gray lines, and EPSPs power spectra are the black lines. Calibration: A, 10 mV, 250 msec; B, 2 mV, 250 msec.
Figure 8.
Figure 8.
Theta frequency modulation of field gamma frequency oscillations in superficial layers. A, Spectrogram of a 3 sec period of field gamma activity in layer II of the mEC. Note the theta frequency occurrence of “hotspots” of power in the gamma band. Bottom trace is raw data trace of the activity shown in spectrogram. B, Spectrogram of a 3 sec period of field gamma activity in layer III of the mEC. Again, bottom trace is raw data trace of the activity analyzed. C, Spectrogram illustrating relative paucity of theta frequency modulation of field gamma oscillation power in the deep mEC. Bottom trace is raw data. Calibration: A–C, 50 μV, 500 msec. Note different scales on the spectrograms
Figure 9.
Figure 9.
Blockade of Ih disrupts theta frequency modulation of field gamma oscillations and subthreshold membrane potential oscillations in stellate cells. A, Control data. i, Concurrent recordings of field from a layer II (top trace) and a layer II stellate neuron (middle trace) demonstrating power modulation of field gamma response coinciding with subthreshold slow membrane potential oscillations in stellate neurons. Bottom trace shows the same data from a stellate cell low-pass filtered at 12 Hz. ii, Spectrogram of field gamma frequency activity illustrating quantal nature of the power in the gamma band. iii, Cross-correlogram of field data versus low-pass filtered stellate membrane potential data. B, Effects of 10 μm ZD7288. i, Concurrent recordings of field from layer II (top trace) and a layer II stellate neuron (middle trace) demonstrating the disruption of power modulation of field gamma response concurrently with disruption of the subthreshold slow membrane potential oscillations in stellate neurons. Bottom trace shows the same data from a stellate cell low-pass filtered at 12 Hz. ii, Spectrogram of field gamma frequency activity illustrating disrupted quantal nature of the power in the gamma band. iii, Cross-correlogram of field data versus low-pass filtered stellate cell membrane potential data. Calibration: Ai, Bi, 20 μV (top traces), 2 mV (bottom traces), 250 msec.

Similar articles

Cited by

References

    1. Alonso A, Llinás RR ( 1989) Subthreshold Na +-dependent theta-like rhythmicity in stellate cells of entorhinal cortex layer II. Nature 342: 175–177. - PubMed
    1. Alonso A, Llinás RR ( 1993) Differential electroresponsiveness of stellate and pyramidal-like cells of medial entorhinal cortex layer II. J Neurophysiol 70: 128–143. - PubMed
    1. Amaral DG, Witter MP ( 1989) The three-dimensional organization of the hippocampal formation: a review of anatomical data. Neuroscience 31: 571–591. - PubMed
    1. Barth DS, MacDonald KD ( 1996) Thalamic modulation of high-frequency oscillating potentials in auditory cortex. Nature 383: 78–81. - PubMed
    1. Beckmann H, Senitz D ( 2002) Developmental malformations in cerebral structures in “endogenous psychoses.” J Neural Transm 109: 421–431. - PubMed

Publication types

MeSH terms

LinkOut - more resources