. 2003 Oct 29;23(30):9873-80.
doi: 10.1523/JNEUROSCI.23-30-09873.2003.

R-cadherin is a Pax6-regulated, growth-promoting cue for pioneer axons

Affiliations

R-cadherin is a Pax6-regulated, growth-promoting cue for pioneer axons

Gracie L Andrews et al. J Neurosci. .

Abstract

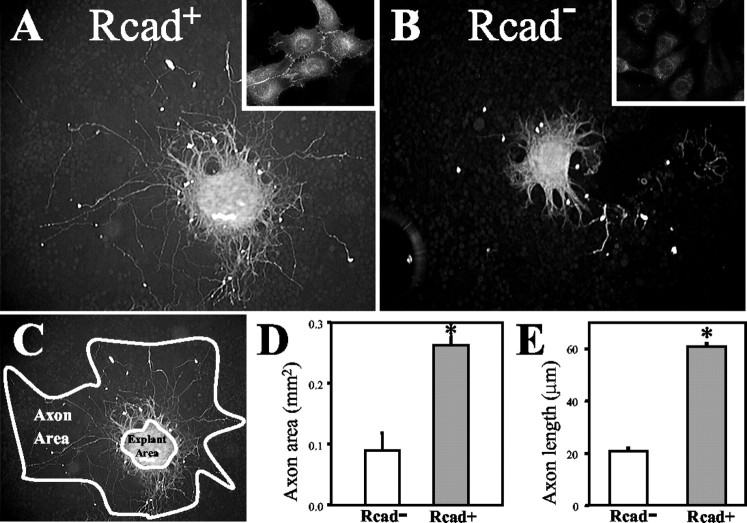
The transcription factor Pax6 has been implicated in two processes that may be related in brain development: establishment of regional cell adhesion properties and axon guidance. In Pax6 mutant mouse embryos, forebrain pioneer axons make pathfinding errors. These errors occur in a region of the ventral thalamus in which the expression of the cell adhesion molecule R-cadherin (Cdh4) is lost in Pax6 mutants. In vitro, an R-cadherin substrate promoted pioneer axon outgrowth. Furthermore, pioneer axon outgrowth was rescued in vivo by selective replacement of R-cadherin by electroporation into cultured Pax6 mutant embryos. Thus, these studies implicate Pax6 as an early brain patterning gene that establishes regional adhesive codes to guide pioneer axons.


Figures

Figure 3.
Figure 3.
R-Cadherin substrate promotes TPOC axon outgrowth in vitro. Tissue containing TPOC cell bodies was dissected from mouse embryos and placed onto monolayers of fibroblasts, either stably transfected with R-cadherin (A) or control cells lacking any cadherin expression (B). Insets in A and B are high-magnification images of cell lines labeled with R-cadherin antibody. After 24 hr of culture, the explants were fixed and labeled with neuron-specific β-tubulin antibody to visualize the axons for quantification. The results shown are typical of at least three independent experiments. C, The extent of axon outgrowth on the two substrates was estimated by comparing the area within the perimeter of the longest axons. D, Graph comparing the axon growth area (mean ± SEM) between the control and R-cadherin substrates, with a significant increase on the R-cadherin substrate (t test; p < 0.001; explant numbers: Rcad +, n = 10; Rcad , n = 9; the sum of two independent experiments for each condition). E, Graph comparing the length (mean ± SEM) of the axons (longest 14–20 per explant) between the control and R-cadherin substrates (p ≪ 0.001; explant numbers: Rcad +, n = 19; Rcad , n = 9).
Figure 4.
Figure 4.
Rescue of axon growth in Pax6 –/– embryos by electroporation of R-cadherin. Pax6 –/– embryos were electroporated with a mixture of R-cadherin and GFP expression plasmids, followed by whole embryo culture. A, Control (anode) side of an electroporated Pax6 –/– embryo. Axon projections are typical of Pax6 mutants, with some axons growing to the VT/DT boundary but few crossing. Mirror image is shown to facilitate comparison with electroporated side. B, High-magnification view of axons on control side. C–E, Other side of same Pax6 –/– embryo, electroporated with R-cadherin and GFP, with GFP pattern shown in E. C, Targeted (cathode) side. Axons project past the VT/DT boundary, with the longest axons reaching the midbrain (MB). D, High-magnification view of R-cadherin electroporated side, showing increased numbers of axons growing to and across boundary. F, Quantification of boundary crossing phenotype in R-cadherin and cadherin-6 electroporated Pax6 –/– embryos. R-Cadherin electroporation led to a significantly increased mean number of axons crossing compared with the control side of each embryo (p < 0.01; paired t test; n = 10 summed from 7 independent experiments). In contrast, cadherin-6 electroporations (Cad6 EP) resulted in significantly fewer axons crossing than for R-cadherin electroporations (Rcad EP) (p < 0.01; t test; n = 4 summed from 2 independent experiments). Scale bar (in E): A, C, E, 200 μm; B, D, 100 μm.
Figure 1.
Figure 1.
Pioneer axon growth through the Pax6 +Rcad + ventral thalamus. A, The pathway taken by TPOC axons through the embryonic mouse forebrain. The axons originate from a cluster of neurons located at the base of the optic stalk (op). The axons pass the optic stalk, continue through VT, and then cross into DT. Planes of section for E–H are indicated by dashed lines. B–D, E10.5 embryos labeled by whole-mount in situ hybridization (purple) for Pax6 (B) or R-cadherin (C), showing overlapping expression in VT. D, An embryo double labeled for R-cadherin (light purple) and TPOC axons (brown). The boundary of the Rcad + VT is indicated by the dashed line. E, F, Comparison of Pax6 and Rcad expression patterns by antibody labeling of sections. E, Section through VT, showing antibody labeling for Pax6 (green, nuclear) and Rcad (red, cell surface). A concentrated area of Rcad labeling is at the pial surface (arrowhead). F, High magnification showing the Rcad + layer at the pial surface (arrowhead). G, Section through TPOC cell bodies (arrowheads), labeled with Rcad antibody (red). H, Same section, with merged image of Rcad (red) and neuron-specific β-tubulin (βtub) antibody (green). Scale bar (in D): A–D, 200 μm; E, 100 μm; F, 50 μm in F; G, H, 25 μm.
Figure 2.
Figure 2.
Loss of R-cadherin in Pax6 –/– embryos correlates with axon errors. A, B, R-Cadherin in situ hybridization on E10.5, comparing wild-type (WT) and Pax6 –/– embryos. Note selective loss of R-cadherin from VT in mutant (B), although expression remains in optic stalk (os) and in cerebral vesicle (cv) (removed to reveal VT). C–F, Tracing of TPOC axons (asterisk, label site), comparing WT (C, E) and mutant (D, F) at two stages. Dashed line indicates the VT/DT boundary, which can be recognized by an external groove in both wild-type and Pax6 mutant embryos. C, D, Thirty-two somite (som) stage (early E10.5). In wild type, the leading axons approach the VT/DT boundary; in the mutant, axons are shorter and make loops in VT. E, F, Forty somite stage (E11). In wild type, more axons project along the pathway, crossing through DT and into midbrain. In mutant embryos (F), a large proportion of axons stop (filled arrowhead) instead of growing into VT. Axon errors include projections into cerebral vesicle (cv) and dorsal turns at the VT/DT boundary instead of crossing (open arrowhead). The axon patterns shown are typical of >100 embryos that were labeled. Scale bar (in B): A–F, 200 μm.

References

    1. Anderson RB, Key B ( 1999) Novel guidance cues during neuronal pathfinding in the early scaffold of axon tracts in the rostral brain. Development 126: 1859–1868. - PubMed
    1. Chitnis AB, Kuwada JY ( 1991) Elimination of a brain tract increases errors in pathfinding by follower growth cones in the zebrafish embryo. Neuron 7: 277–285. - PubMed
    1. Dickson BJ ( 2002) Molecular mechanisms of axon guidance. Science 298: 1959–1964. - PubMed
    1. Easter Jr SS, Ross LS, Frankfurter A ( 1993) Initial tract formation in the mouse brain. J Neurosci 13: 285–299. - PMC - PubMed
    1. Grindley JC, Hargett LK, Hill RE, Ross A, Hogan BL ( 1997) Disruption of PAX6 function in mice homozygous for the Pax6Sey-1Neu mutation produces abnormalities in the early development and regionalization of the diencephalon. Mech Dev 64: 111–126. - PubMed

Publication types

MeSH terms