. 2003 Oct 29;23(30):9888-96.
doi: 10.1523/JNEUROSCI.23-30-09888.2003.

Different mechanisms promote astrocyte Ca2+ waves and spreading depression in the mouse neocortex

Affiliations

Different mechanisms promote astrocyte Ca2+ waves and spreading depression in the mouse neocortex

Oliver Peters et al. J Neurosci. .

Abstract

Cortical spreading depression (CSD) is thought to play an important role in different pathological conditions of the human brain. Here we investigated the interaction between CSD and Ca2+ waves within the astrocyte population in slices from mouse neocortex (postnatal days 10-14). After local KCl ejection as a trigger for CSD, we recorded the propagation of Ca2+ increases within a large population of identified astrocytes in synchrony with CSD measured as intrinsic optical signal (IOS) or negative DC-potential shift. The two events spread with 39.2 +/- 3.3 mum/sec until the IOS and negative DC-potential shift decayed after approximately 1 mm. However, the astrocyte Ca2+ wave continued to propagate for up to another 500 microm but with a reduced speed of 18.3 +/- 2.5 microm/sec that is also typical for glial Ca2+ waves in white matter or culture. While blocking CSD using MK-801 (40 microm), an NMDA-receptor antagonist, the astrocyte Ca2+ wave persisted with a reduced speed (13.2 +/- 1.5 microm/sec). The specific gap junction blocker carbenoxolon (100 microm) did not prevent CSD but decelerated the speed (2.9 +/- 0.9 microm/sec) of the astrocyte Ca2+ wave in the periphery of CSD. We also found that interfering with intracellular astrocytic Ca2+ signaling by depletion of internal Ca2+ stores does not affect the spread of the IOS. We conclude that CSD determines the velocity of an accompanying astrocytic Ca2+ response, but the astrocyte Ca2+ wave penetrates a larger territory and by this represents a self-reliant phenomenon with a different mechanism of propagation.


Figures
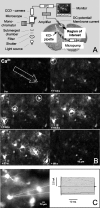
Figure 1.
Figure 1.
Ca2+ signals observed in neocortical astrocytes. A, A diagram of the experimental setup and the slice preparation placed in a submerged chamber. CSD was elicited by a focal release of KCl from a micropipette via a micropump. The white rectangle, situated in layers II–IV of the frontal cortex, denotes the observed region of interest. The fluorescence and IOS were recorded by a computer system (PC). Membrane currents or extracellular field potentials were measured, amplified, and transferred to a computer (PC). B, Ca2+ increases, measured as fluorescence changes in slices bulk loaded with the Ca2+ fluorescent dye Fluo-4, were recorded from the region of interest during CSD. The white dotted arrow indicates the direction in which CSD spreads. Dotted circles highlight cells that responded at the indicated time after stimulation. C, A cell responding with a fluorescence increase (left image) was approached with the patch pipette (dotted lines), and membrane currents were recorded. The membrane was clamped at -80 mV and depolarized and hyperpolarized to -170 and +10 mV, respectively, with 10 mV increments. Note the passive membrane currents characteristic of astrocytes.
Figure 2.
Figure 2.
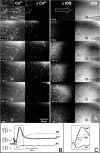
Correlation of DC-potential shift, astrocytic Ca2+ increases, and IOS. A, A sequence of fluorescence images displaying changes in Ca2+ (left columns) and corresponding IOS (right columns) were recorded with low magnification (10×). Fluo-4 fluorescence is displayed as contrast-enhanced images (Ca2+) or as images in which the background (i.e., image before stimulation) was subtracted (ΔCa2+). In the same manner, the IOS and ΔIOS are displayed on the right and were recorded with a delay to the fluorescence signal of 600 msec. As indicated by the white dotted arrows in the first rows, CSD spread from the left to the right. Note that the frontlines of the astrocytic Ca2+ wave spread ∼100 μm ahead of IOS changes. The time in the left bottom corner of each picture indicates time after stimulation. B, A DC pipette was placed close to a stained astrocyte (as indicated in the first images; dotted lines refer to the extracellular recording electrode, and the circle denotes the region of interest from which fluorescence and light transmittance were recorded). The arrow (S) indicates the time of KCl ejection. Background-subtracted fluorescence signal corresponding to changes in Ca2+F/F0), IOS (ΔT/T0), and the DC potential (ΔU) are displayed. C, Trace in B with higher time resolution. Whereas the onset of the Ca2+ increase and negative DC-potential shift occurred simultaneously, the IOS signal occurred with a delay of 5–8 sec.
Figure 3.
Figure 3.
Astrocytic Ca2+ signals spread farther than IOS. A, B, IOS (A) and Fluo-4 fluorescence correlated to Ca2+ signals (B) were studied in a cortical slice. The circles define the regions of interest from which IOS and fluorescence signals were recorded as a function of distance from the stimulation pipette. The arrow denotes the direction in which the signals spread. The dotted line indicates how far the IOS spreads. C, The three traces on the left display the background-corrected IOS (ΔT/T0) at the three regions indicated in A. The traces on the right show the first derivative, which represents a better measure of the IOS strength than the amplitude. D, The three traces display the background corrected changes in Ca2+F/F0) at the three regions indicated in B. The traces on the left are shown in an expanded time scale to better illustrate the delays in the peak. E, The amplitude of the first derivative of the IOS [Max (dT/dt)] was plotted as a function of distance to the stimulation pipette. Note the decline in the IOS at ∼500 μm. The data points were fitted by a two-exponential function. F, The velocity of the Ca2+ wave was determined by measuring the time between Ca2+ peaks of two closely apposed fluorescent cells and was plotted as a function of distance from the stimulation pipette. The dotted line indicates the fit in E. Velocity values between 0 and 450 μm(40.9±3.2 μm/sec; 80–100% of IOS) and 600 and 1100 μm (20.7 ± 5.5 μm/sec; 0–20% of the IOS) were fitted. The fits thus indicate the two different speeds of the astrocytic Ca2+ wave in the core area and the peripheral zone.
Figure 4.
Figure 4.
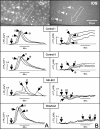
Ca2+ signals of single astrocytes and the corresponding IOS in the core versus the periphery. Similar as described in Figure 3, fluorescence changes (F/F0) from four different astrocytes and the corresponding IOS (ΔT/T0) were recorded. This region was selected because it contained the zone in which the IOS signal decayed (indicated by the dotted line), and it is shown in higher magnification as in Figure 3. On the top, the fluorescence image is shown with the selected cells indicated by circles and labeled by Roman numbers. Below are the responses of the four different cells. Note the occurrence of spontaneous astrocytic Ca2+ activity (arrow with an asterisk; cells I and II).
Figure 5.
Figure 5.
Astrocytic membrane currents can only be detected in the core of CSD. A, Membrane currents (I) and ΔF/F0 were recorded from an astrocyte identified by its current pattern. The cell was selected close to the stimulation pipette, and the direction of the wave is indicated by an arrow. Note the inward current in response to stimulation (S). B, With a similar paradigm as described in A, current and Ca2+ responses were recorded from an astrocyte distant to the stimulation pipette. While a Ca2+ signal was recorded, no change in membrane current was observed. Note the biphasic Ca2+ response typical for cells in the periphery.
Figure 6.
Figure 6.
MK-801 blocks CSD and decelerates the astrocyte Ca2+ wave. Two control experiments were performed before MK-801 was applied. Repeatedly triggered CSDs induced reproducible Ca2+ increases in astrocytes. Characteristically, the IOS lost the four-phasic shape, when CSD was triggered many times in short intervals, although negative DC shifts remained comparable. The NMDA receptor blocker MK-801 prevented CSD. In contrast, an astrocytic Ca2+ wave with a significantly lowered speed, preceded by a rapid increase to a sustained plateau, was still detectable. During washout, the astrocytic Ca2+ signals were restored, although IOS changes did not indicate a complete recovery of the CSD. S, Stimulation.
Figure 7.
Figure 7.
Ca2+responses of a closely apposed neuron and astrocyte during CSD. A neuron in close proximity to a bulk-loaded astrocyte was selected for patch clamping (fluorescence image on the top right). The patch pipette was filled with Fluo-4 salt to load the neuron with the Ca2+ sensor. This allowed us to record Ca2+ responses (ΔF/F0) from the neuron and the astrocyte and current (I) from the neuron and IOS (ΔT/T0) at the region of interest selected for neuron and astrocyte (ΔT/T0). Time of KCl ejection (S, stimulation) is indicated by an arrow. The perfusion was switched off 60 sec before stimulation. Note the increasing spontaneous Ca2+ activity in both cells. The traces on the right with an expanded time scale illustrate the synchronous Ca2+ activity of the neuron and the astrocyte. The vertical lines indicate the Ca2+ peaks.
Figure 8.
Figure 8.
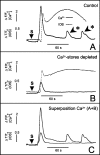
Depletion of internal Ca2+ stores does not influence the spread of IOS. A, B, A Ca2+ response (ΔF/F0) and IOS (ΔT/T0) were recorded from an astrocyte in response to KCl stimulation (S) before (A, control) and after (B) Ca2+ stores were depleted. To deplete stores, thapsigargin was added for 10 min, and subsequently ATP was applied for 1 min. The second response was elicited 60 min after the control. C, Superposition of the Ca2+ responses from A and B. Note the occurrence of spontaneous astrocytic Ca2+ activity (arrows with an asterisk).

References

    1. Anderson TR, Andrew RD ( 2002) Spreading depression: imaging and blockade in the rat neocortical brain slice. J Neurophysiol 88: 2713–2725. - PubMed
    1. Araque A, Carmignoto G, Haydon PG ( 2001) Dynamic signaling between astrocytes and neurons. Annu Rev Physiol 63: 795–813. - PubMed
    1. Back T, Ginsberg MD, Dietrich WD, Watson BD ( 1996) Induction of spreading depression in the ischemic hemisphere following experimental middle cerebral artery occlusion: effect on infarct morphology. J Cereb Blood Flow Metab 16: 202–213. - PubMed
    1. Basarsky TA, Duffy SN, Andrew RD, MacVicar BA ( 1998) Imaging spreading depression and associated intracellular calcium waves in brain slices. J Neurosci 18: 7189–7199. - PMC - PubMed
    1. Basarsky TA, Feighan D, MacVicar BA ( 1999) Glutamate release through volume-activated channels during spreading depression. J Neurosci 19: 6439–6445. - PMC - PubMed

Publication types

MeSH terms

LinkOut - more resources