

Improved neural representation of vowels in electric stimulation using desynchronizing pulse trains
- PMID: 14587608
- PMCID: PMC2275169
- DOI: 10.1121/1.1612494
Improved neural representation of vowels in electric stimulation using desynchronizing pulse trains
Abstract
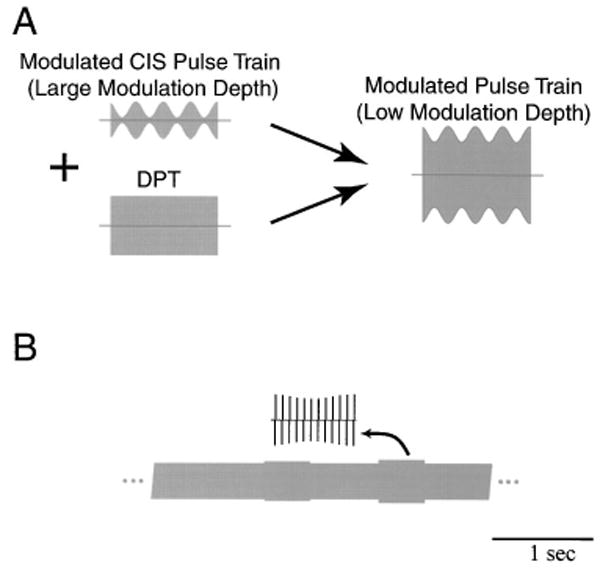
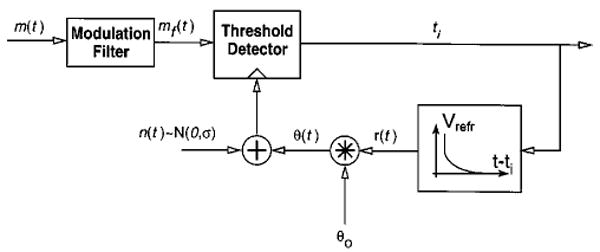
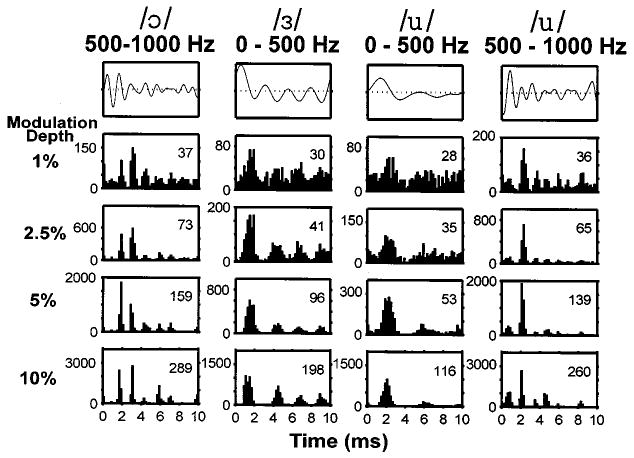
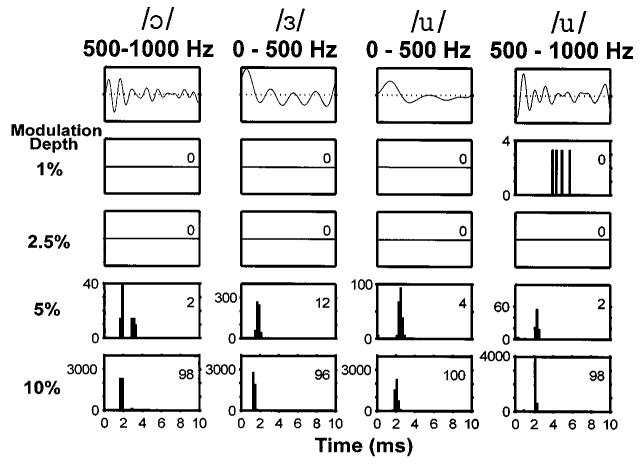
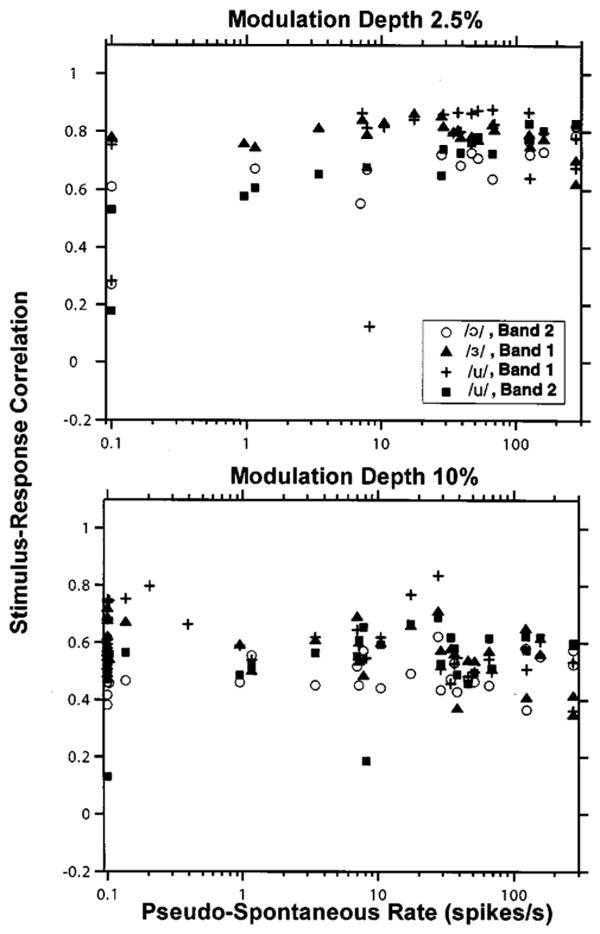
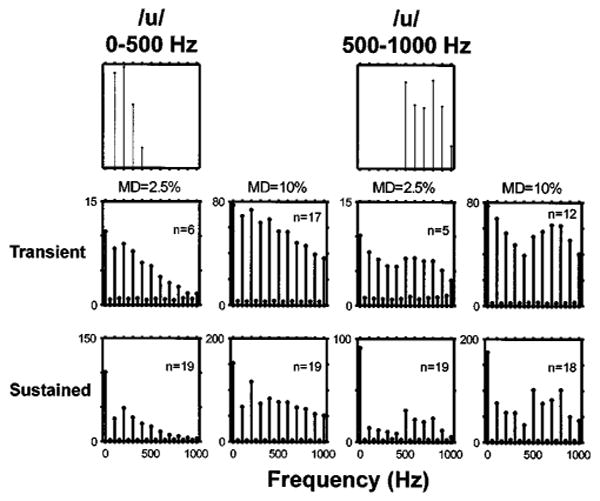
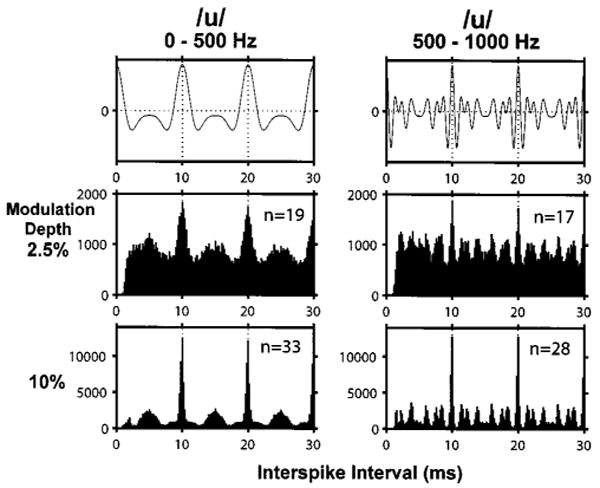
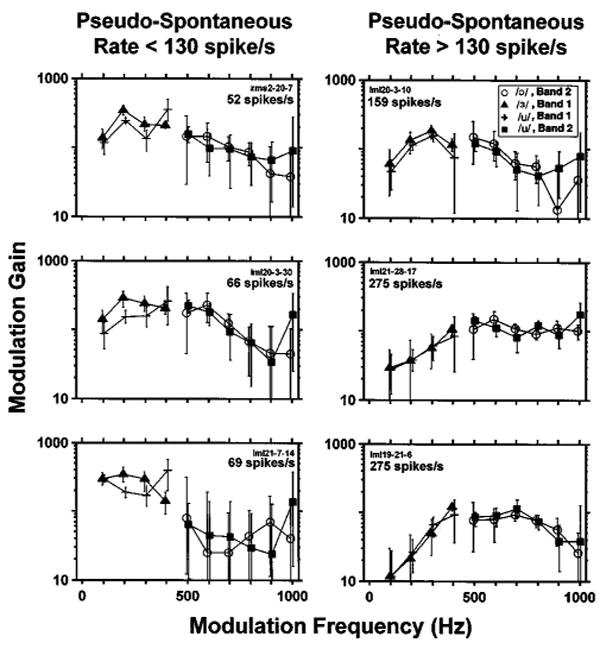
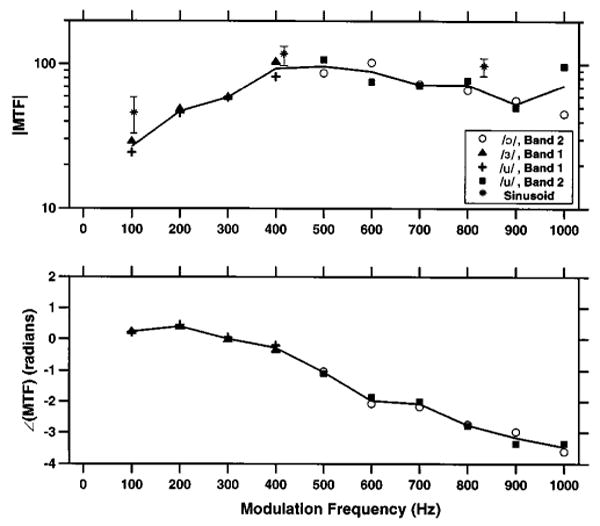
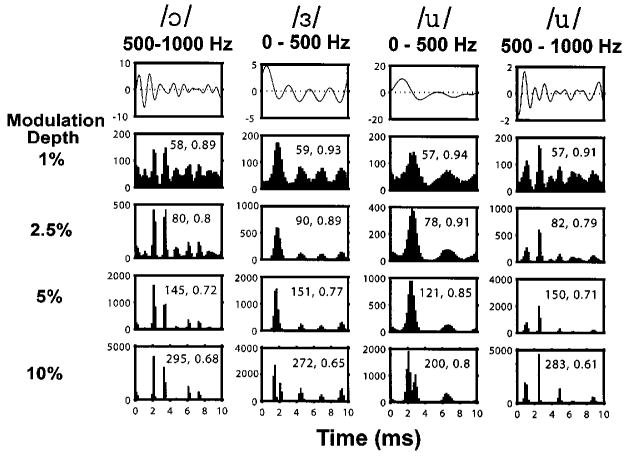
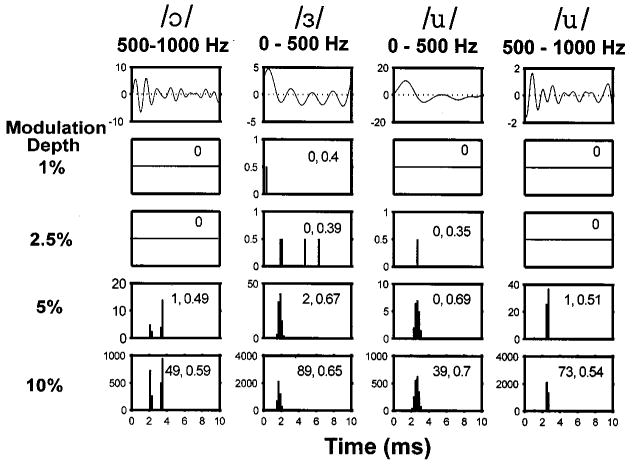
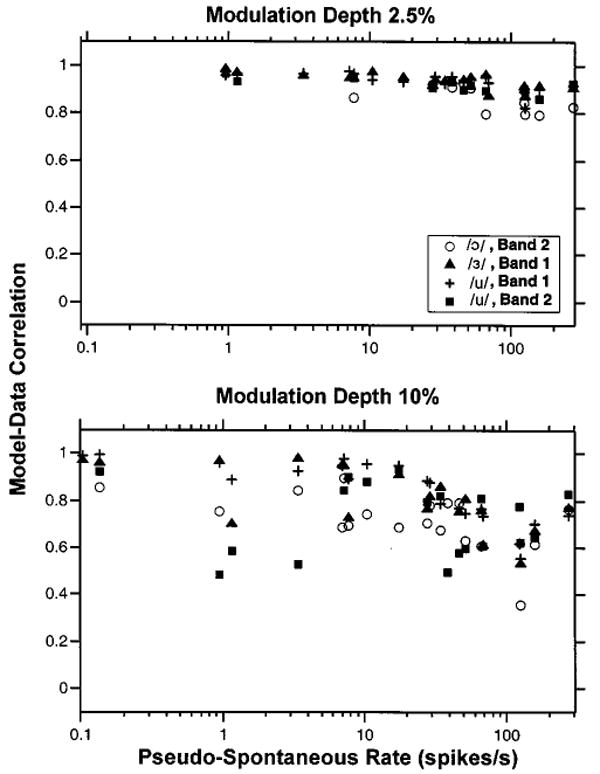
Current cochlear implant processors poorly represent sound waveforms in the temporal discharge patterns of auditory-nerve fibers (ANFs). A previous study [Litvak et al., J. Acoust. Soc. Am. 114, 2079-2098 (2003)] showed that the temporal representation of sinusoidal stimuli can be improved in a majority of ANFs by encoding the stimuli as small modulations of a sustained, high-rate (5 kpps), desynchronizing pulse train (DPT). Here, these findings are extended to more complex stimuli by recording ANF responses to pulse trains modulated by bandpass filtered vowels. Responses to vowel modulators depended strongly on the discharge pattern evoked by the unmodulated DPT. ANFs that gave sustained responses to the DPT had period histograms that resembled the modulator waveform for low (< 5%) modulation depths. Spectra of period histograms contained peaks near the formant frequencies. In contrast, ANFs that gave a transient (< 1 min) response to the DPT poorly represented the formant frequencies. A model incorporating a linear modulation filter, a noisy threshold, and neural refractoriness predicts the shapes of period histograms for both types of fibers. These results suggest that a DPT-enhanced strategy may achieve good representation of the stimulus fine structure in the temporal discharge patterns of ANFs for frequencies up to 1000 Hz. It remains to be seen whether these temporal discharge patterns can be utilized by cochlear implant subjects.
Figures
Comment on
-
Desynchronization of electrically evoked auditory-nerve activity by high-frequency pulse trains of long duration.J Acoust Soc Am. 2003 Oct;114(4 Pt 1):2066-78. doi: 10.1121/1.1612492. J Acoust Soc Am. 2003. PMID: 14587606 Free PMC article.
-
Improved temporal coding of sinusoids in electric stimulation of the auditory nerve using desynchronizing pulse trains.J Acoust Soc Am. 2003 Oct;114(4 Pt 1):2079-98. doi: 10.1121/1.1612493. J Acoust Soc Am. 2003. PMID: 14587607 Free PMC article.
Similar articles
-
Improved temporal coding of sinusoids in electric stimulation of the auditory nerve using desynchronizing pulse trains.J Acoust Soc Am. 2003 Oct;114(4 Pt 1):2079-98. doi: 10.1121/1.1612493. J Acoust Soc Am. 2003. PMID: 14587607 Free PMC article.
-
Desynchronization of electrically evoked auditory-nerve activity by high-frequency pulse trains of long duration.J Acoust Soc Am. 2003 Oct;114(4 Pt 1):2066-78. doi: 10.1121/1.1612492. J Acoust Soc Am. 2003. PMID: 14587606 Free PMC article.
-
Auditory nerve fiber responses to electric stimulation: modulated and unmodulated pulse trains.J Acoust Soc Am. 2001 Jul;110(1):368-79. doi: 10.1121/1.1375140. J Acoust Soc Am. 2001. PMID: 11508961 Free PMC article.
-
Neural encoding of single-formant stimuli in the cat. I. Responses of auditory nerve fibers.J Neurophysiol. 1993 Sep;70(3):1054-75. doi: 10.1152/jn.1993.70.3.1054. J Neurophysiol. 1993. PMID: 8229159
-
The representation of the spectra and fundamental frequencies of steady-state single- and double-vowel sounds in the temporal discharge patterns of guinea pig cochlear-nerve fibers.J Acoust Soc Am. 1990 Sep;88(3):1412-26. doi: 10.1121/1.400329. J Acoust Soc Am. 1990. PMID: 2229676
Cited by
-
Temporal Envelope Coding by Inferior Colliculus Neurons with Cochlear Implant Stimulation.J Assoc Res Otolaryngol. 2017 Dec;18(6):771-788. doi: 10.1007/s10162-017-0638-4. Epub 2017 Jul 17. J Assoc Res Otolaryngol. 2017. PMID: 28717877 Free PMC article.
-
Dynamical instability determines the effect of ongoing noise on neural firing.J Assoc Res Otolaryngol. 2009 Jun;10(2):251-67. doi: 10.1007/s10162-008-0148-5. Epub 2009 Mar 24. J Assoc Res Otolaryngol. 2009. PMID: 19308644 Free PMC article.
-
A point process framework for modeling electrical stimulation of the auditory nerve.J Neurophysiol. 2012 Sep;108(5):1430-52. doi: 10.1152/jn.00095.2012. Epub 2012 Jun 6. J Neurophysiol. 2012. PMID: 22673331 Free PMC article.
-
Effect of stimulation rate on cochlear implant users' phoneme, word and sentence recognition in quiet and in noise.Audiol Neurootol. 2011;16(2):113-23. doi: 10.1159/000315115. Epub 2010 Jul 17. Audiol Neurootol. 2011. PMID: 20639631 Free PMC article. Clinical Trial.
-
Effects of temporal fine structure on the lateralization of speech and on speech understanding in noise.J Assoc Res Otolaryngol. 2007 Sep;8(3):373-83. doi: 10.1007/s10162-007-0074-y. Epub 2007 Feb 27. J Assoc Res Otolaryngol. 2007. PMID: 17332969 Free PMC article.
References
-
- Assmann PF, Summerfield Q. Modeling the perception of concurrent vowels: vowels with different fundamental frequencies. J Acoust Soc Am. 1990;88:680–697. - PubMed
-
- Cariani PA, Delgutte B. Neural correlates of the pitch of complex tones. I. Pitch and pitch salience. J Neurophysiol. 1996a;76:1698–1716. - PubMed
-
- Cariani PA, Delgutte B. Neural correlates of the pitch of complex tones. II. Pitch shift, pitch ambiguity, phase invariance, pitch circularity, rate pitch, and the dominance region for pitch. J Neurophysiol. 1996b;76:1717–1734. - PubMed
-
- Delgutte B. Speech coding in the auditory nerve: II. Processing schemes for vowel-like sounds. J Acoust Soc Am. 1984;75:879–886. - PubMed
-
- Delgutte B, Kiang NYS. Speech coding in the auditory nerve: I. Vowel-like sounds. J Acoust Soc Am. 1984;75:866–878. - PubMed
Publication types
MeSH terms
Substances
Grants and funding
LinkOut - more resources
Full Text Sources
Other Literature Sources
Medical