. 2003 Nov;14(11):4526-40.
doi: 10.1091/mbc.e03-01-0039.

Dictyostelium stress-activated protein kinase alpha, a novel stress-activated mitogen-activated protein kinase kinase kinase-like kinase, is important for the proper regulation of the cytoskeleton

Affiliations

Dictyostelium stress-activated protein kinase alpha, a novel stress-activated mitogen-activated protein kinase kinase kinase-like kinase, is important for the proper regulation of the cytoskeleton

Binggang Sun et al. Mol Biol Cell. 2003 Nov.

Abstract

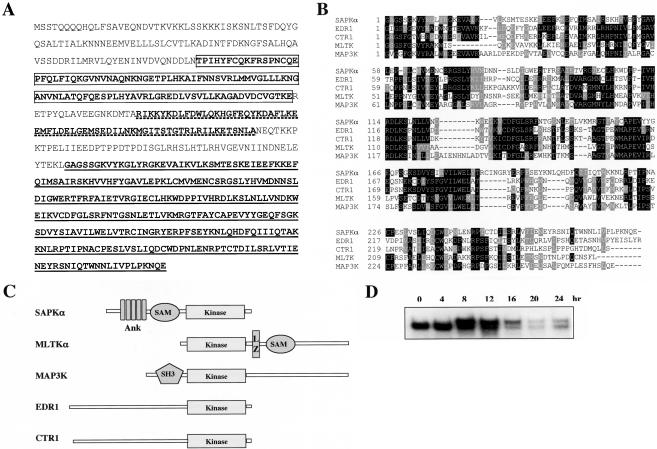
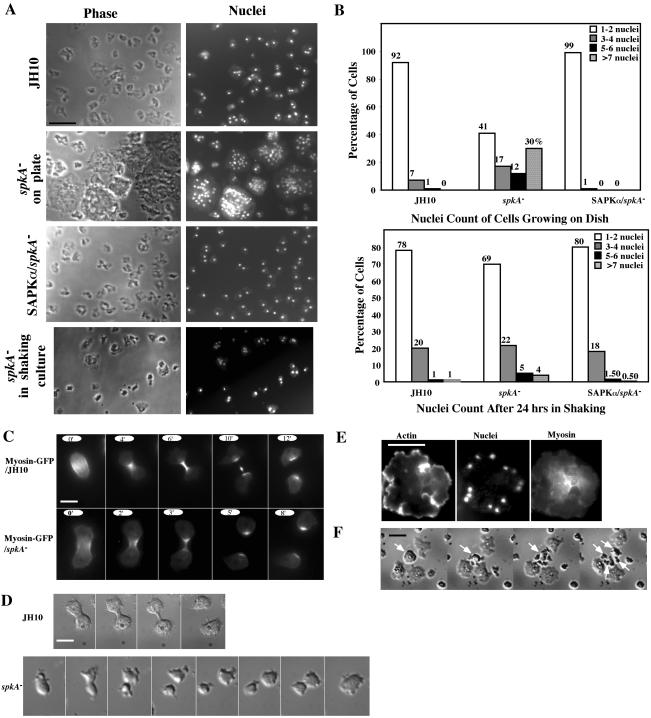
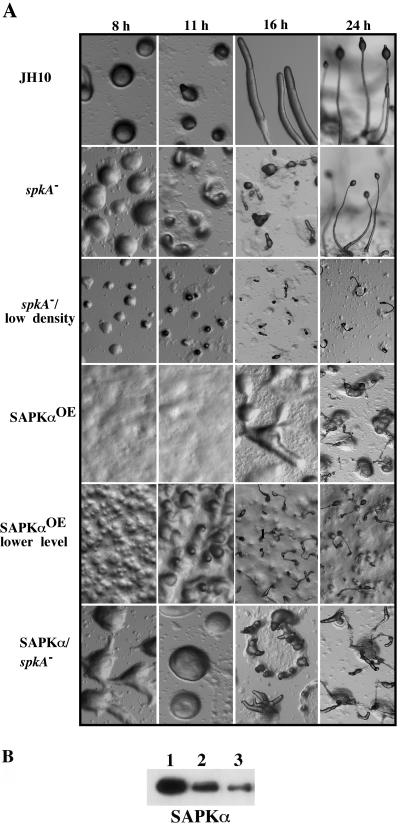
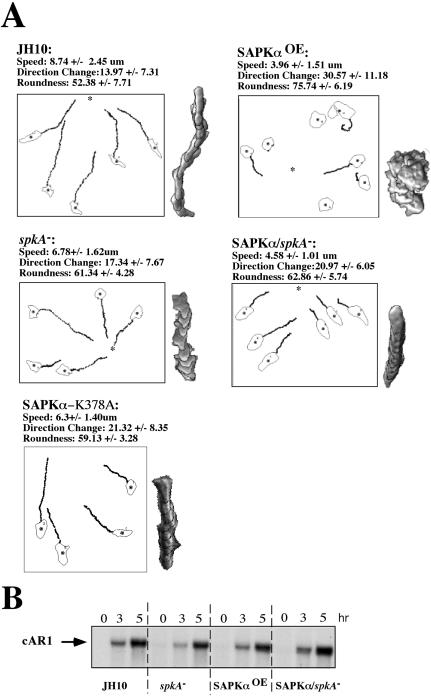
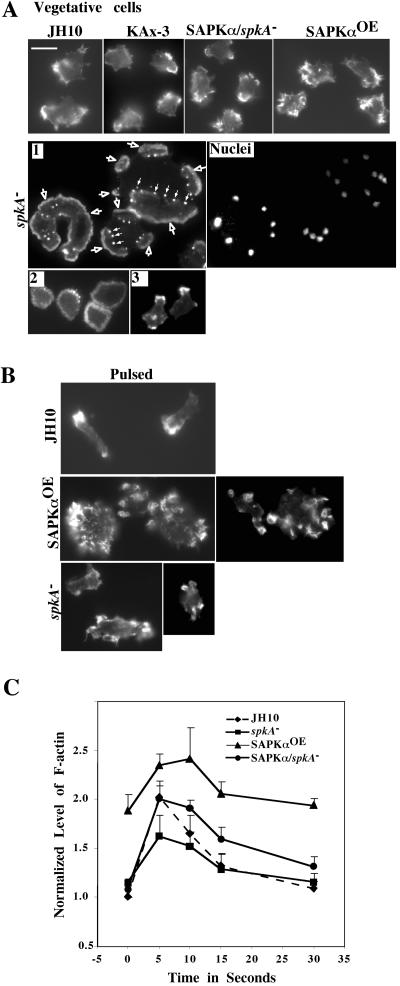
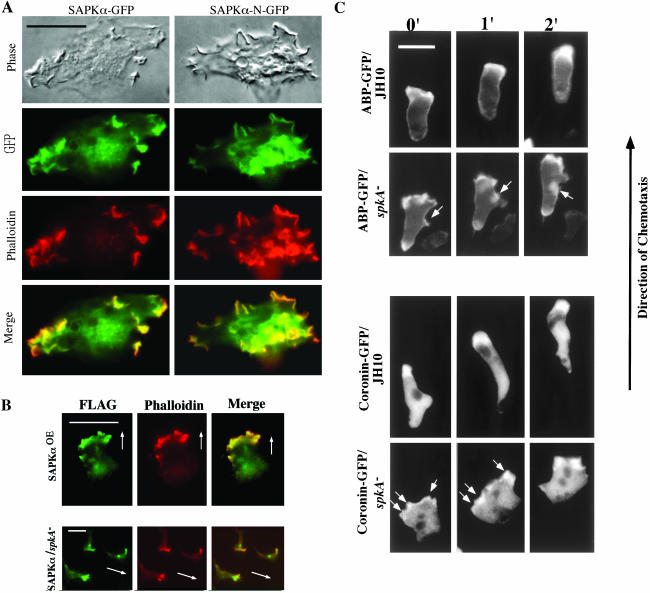
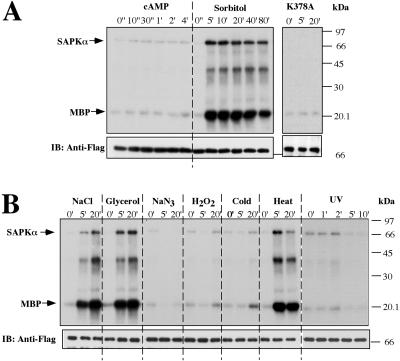
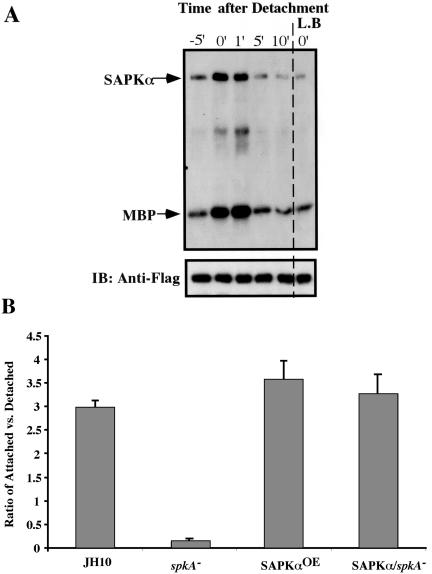
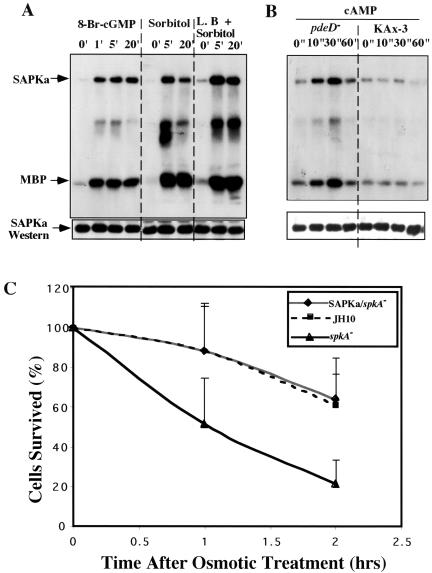
Mitogen-activated protein kinase cascades regulate various cellular functions, including growth, cell differentiation, development, and stress responses. We have identified a new Dictyostelium kinase (stress-activated protein kinase [SAPK]alpha), which is related to members of the mixed lineage kinase class of mitogen-activated protein kinase kinases. SAPKalpha is activated by osmotic stress, heat shock, and detachment from the substratum and by a membrane-permeable cGMP analog, a known regulator of stress responses in Dictyostelium. SAPKalpha is important for cellular resistance to stresses, because SAPKalpha null cells exhibit reduced viability in response to osmotic stress. We found that SAPKalpha mutants affect cellular processes requiring proper regulation of the actin cytoskeleton, including cell motility, morphogenesis, cytokinesis, and cell adhesion. Overexpression of SAPKalpha results in highly elevated basal and chemoattractant-stimulated F-actin levels and strong aggregation and developmental defects, including a failure to polarize and chemotax, and abnormal morphogenesis. These phenotypes require a kinase-active SAPKalpha. SAPKalpha null cells exhibit reduced chemoattractant-stimulated F-actin levels, cytokinesis, developmental and adhesion defects, and a motility defect that is less severe than that exhibited by SAPKalpha-overexpressing cells. SAPKalpha colocalizes with F-actin in F-actin-enriched structures, including membrane ruffles and pseudopodia during chemotaxis. Although SAPKalpha is required for these F-actin-mediated processes, it is not detectably activated in response to chemoattractant stimulation.


Figures

Figure 1.
Figure 1.
Sequence analysis of Dictyostelium SAPKα. (A) Deduced amino acid sequence of SAPKα from the 2075-base pair cDNA clone. The boxed region at the N terminus is the ankyrin repeat domain. The kinase domain at the C terminus is underlined. The SAM domain in the middle is also underlined but with dashed lines. (B) Alignment of the kinase domain of SAPKα with that of other kinases including tomato CTR1 (AF110519), barley EDR1 (AF305912), human MAP3K (NM_002446), and mouse MLTKα (AB049731). (C) Schematic diagram of the domain structures of SAPKα and other kinases with close homology in the kinase domain. Ank, ankyrin repeat motifs. (D) Northern blot showing the developmental time course of SAPKα expression. Total RNA of 8 μg per sample was resolved on a 1.0% denaturing agarose gel, blotted and probed as described previously (Datta and Firtel, 1987). The 0-h time point is for vegetative cells.
Figure 2.
Figure 2.
Cytokinesis defect of spkA null cells. (A) Images of spkA null cells growing either on plates or in shaking culture. Cells were fixed with 3.7% formaldehyde on coverslips and stained with Hoechst dye. spkA null cells grow on plates as large cells with multiple nuclei, but they divide much better in shaking culture. Control JH10 cells and spkA null cells expressing exogenous SAPKα divide normally. Bar, 30 μm. (B) Quantitative analysis of the cytokinesis defect of spkA null cells. Cells either grown on plates or 24 h after being transferred from plates to shaking culture were allowed to adhere on coverslips, fixed, and stained with Hoechst dye. The nuclei from as many as 300 cells were counted for each strain. (C) Myosin localization does not seem to be affected in spkA null cells. JH10 and spkA null cells expressing myosin-GFP were plated on coverslips and cell divisions were recorded using the GFP channel. For JH10 cells, frames were taken every 30 s. For spkA null cells, frames were taken at 1-min intervals due to increased sensitivity of cells to UV light. Bar, 10 μm. (D) Time-lapse recording of division of JH10 and spkA null cells. Although JH10 cells divide normally, spkA null cells often fail to divide due to incomplete separation and subsequent fusion of the two daughter cells. Bar, 10 μm. (E) Image showing a large dividing spkA null cell stained for actin, myosin, and nuclei. Bar, 30 μm. (F) Time-lapse recording of division of a large spkA null cell. One large spkA null cell eventually divided into 4 daughter cells, as indicated by arrows. Bar, 50 μm.
Figure 3.
Figure 3.
Developmental phenotypes of spkA null cells and cells expressing wild-type SAPKα. (A) Cells grown in axenic medium were washed twice with Na/K phosphate buffer and plated on nonnutrient agar plates. Photographs were taken at various developmental stages at the same magnification. For spkA null cells, developmental phenotypes at both lower and higher density are shown. (B) Western blot showing levels of expression of SAPKα in three individual clones: 1, highest expression level (developmental data not shown); 2, medium level (shown as SAPKαOE in A); and 3, lowest level (shown as SAPKαOE lower in A).
Figure 4.
Figure 4.
Chemotaxis analysis of spkA null cells and cells expressing wild-type SAPKα. (A) Chemotaxis assay. Cells were washed and pulsed every 6 min for 5 h with 30 nM cAMP (see MATERIALS AND METHODS). Cells were plated on a Petri dish specifically made for observing cells by using an inverted microscope and placed close to a micropipette filled with 150 μM cAMP. Cell movements were recorded with NIH Image software and analyzed using the DIAS program. Comparison of cell shape, direction change, and speed of the movement of different cells is shown. A representative cell from each type of cells is shown. The recordings are made at 10 frames/min and 15–20 randomly chosen cells were analyzed for each strain. The image was obtained by superimposing nine frames at 1-min intervals between frames. (B) cAR1 Northern blot. Cells were pulsed and 2 × 10⁷ cells were sampled at the indicated time points. Total RNA was prepared and 6 μg was resolved on a 1% formaldehyde denaturing agarose gel, transferred to nylon membrane, and hybridized to a cAR1 probe.
Figure 5.
Figure 5.
Abnormal actin organization in spkA null cells and SAPKαOE cells. Cells in the vegetative growth state (A) or after pulsing (B) were plated on cover slips and fixed and stained with phalloidin as described in MATERIALS AND METHODS. For vegetative spkA null cells, representative cells from three different populations were shown (1–3). Population 1 (1) are mainly large, multinucleate cells which were also stained for nuclei. Population 2 (2) are cells with one or two nuclei and show ring-like staining. Population 3 (3) are cells with one or two nuclei and have a staining pattern more like that of parental JH10 cells. White arrows indicate flattened lamellipodia of different sizes typically seen in these cells. Multiple eupodia were also present in theses cells (indicated by white arrows with black centers). Bar, 10 μm. (C) Actin polymerization assay. F-actin levels before and after cAMP stimulation were measured and normalized against the amount of protein.
Figure 6.
Figure 6.
Localization of SAPKα. (A) Wild-type cells expressing full-length SAPKα-GFP or N-terminal SAPKα-GFP were pulsed with cAMP, fixed, and stained with TRITC-phalloidin as described in MATERIALS AND METHODS. Phase contrast and fluorescence images indicate that SAPKα was enriched in multiple actin-rich structures on the cell surface. Bar, 5 μm. (B) Localization of SAPKα in chemotaxing cells. Wild-type cells (top) or spkA null cells (bottom) expressing full-length SAPKα-FLAG were pulsed with cAMP and cells were plated onto cover slips and allowed to aggregate. Cells were then fixed and stained with TRITC-phalloidin and anti-FLAG mAb as described in MATERIALS AND METHODS. White arrows indicate the directions of movement. Bar, 10 μm. (C) Chemotaxis of spkA null cells was examined using ABP-GFP and coronin-GFP as markers. In JH10 cells, both ABP-GFP and coronin-GFP localized to a well-defined leading edge pseudopodium. spkA null cells, however, had a broader leading edge and both markers localized to the lateral cortex (as indicated by arrows).
Figure 7.
Figure 7.
Activation of SAPKα by various stimuli. (A) Activation of SAPKα by osmotic shock but not by cAMP. For cAMP stimulation, aggregation-competent cells made by pulsing (see MATERIALS AND METHODS) were stimulated with 100 μM cAMP. For osmotic shock stimulation, vegetative cells were washed with Na/K phosphate buffer, starved for 1 h, and treated with 0.4 M sorbitol. Aliquots were taken at the indicated time points. Cells were lysed, SAPKα or its mutant was immunoprecipitated with anti-FLAG mAb, and kinase activity was measured as described in MATERIALS AND METHODS. The kinase dead SAPKα K378A was used as a negative control. (B) Activation of SAPKα in other stress conditions. To confirm the osmotic response of SAPKα, 0.4 M NaCl, and 0.4 M glycerol were also tested. For heat shock treatment, cells were incubated at 30°C. For cold shock, cells were incubated at 4°C. For UV treatment, cells were placed in a dish on a shaker and exposed to 300-nm UV light. Cells were also treated with 3 mM H2O2 and 1 mM NaN3. The top band shows the autophosphorylated SAPKα. The bottom band shows phosphorylated MBP. The middle band might represent a protein coimmunoprecipitated and phosphorylated by SAPKα. To examine the immunoprecipitated SAPKα protein level, a Western blot was carried out on the same blot used for kinase assay (bottom).
Figure 9.
Figure 9.
SAPKα affects cell adhesion. (A) Activation of SAPKα by detachment. Cells were plated onto culture plates and allowed to attach for 30 min. Cells were then quickly resuspended by pipetting and transferred to shaking culture. At the time point indicated, cells were lysed in an equal volume of 2× lysis buffer and SAPKα kinase activity was determined accordingly. For the 0-min time point, cells were lysed immediately after detachment from the plate. For the -5-min time point, cells were lysed 5 min before the experiment directly on the plate by adding 1× lysis buffer. Kinase activation by detachment was also measured after treatment of cells with 1 μM latrunculin B. (B) Cell-substratum adhesion assay on spkA null and SAPKαOE cells. Cell adhesion assays were performed using nitrocellulose filters as described in MATERIALS AND METHODS. Adhesion was measured by the ratio of attached compared with unattached cells. Experiments were performed at least three times. Bar, 10 μm.
Figure 8.
Figure 8.
SAPKα provides protection against osmotic stress. (A) SAPKα activation by 8-Br-cGMP. A kinase assay was performed with the addition of 20 mM 8-Br-cGMP, a cell membrane-permeable cGMP. As a positive control, cells were treated with 0.4 M sorbitol. To examine the effects of latrunculin B, cells were treated with 1 μM latrunculin B (L.B.) for 10 min before osmotic stress stimulation. (B) SAPKα activation by cAMP in pdeD null cells. Cells were pulsed and stimulated with 150 μM cAMP for 5 h and SAPKα kinase assays were performed as usual. (C) Cell survival after osmotic stress. Cells were shaken in Na/K phosphate buffer in the presence or absence of 0.4 M sorbitol for the times indicated, diluted with buffer, and plated onto SM agar plates with Klebsiella aerogenes bacteria. Cell viability was determined as the percentage of colonies compared with wild-type controls.

Similar articles

Cited by

References

    1. Aizawa, H., Katadae, M., Maruya, M., Sameshima, M., Murakami-Murofushi, K., and Yahara, I. (1999). Hyperosmotic stress-induced reorganization of actin bundles in Dictyostelium cells over-expressing cofilin. Genes Cells 4, 311-324. - PubMed
    1. Aubry, L., and Firtel, R. (1999). Integration of signaling networks that regulate Dictyostelium differentiation. Annu. Rev. Cell Dev. Biol. 15, 469-517. - PubMed
    1. Canman, C.E., and Kastan, M.B. (1996). Signal transduction. Three paths to stress relief. Nature 384, 213-214. - PubMed
    1. Chang, L., and Karin, M. (2001). Mammalian MAP kinase signalling cascades. Nature 410, 37-40. - PubMed
    1. Chaudoir, B.M., Kowalczyk, P.A., and Chisholm, R.L. (1999). Regulatory light chain mutations affect myosin motor function and kinetics. J. Cell Sci. 112, 1611-1620. - PubMed

Publication types

MeSH terms

LinkOut - more resources