. 2003 Nov 11;100(23):13350-5.
doi: 10.1073/pnas.2235735100. Epub 2003 Oct 31.

Gene expression patterns in human embryonic stem cells and human pluripotent germ cell tumors

Affiliations

Gene expression patterns in human embryonic stem cells and human pluripotent germ cell tumors

Jamie M Sperger et al. Proc Natl Acad Sci U S A. .

Abstract

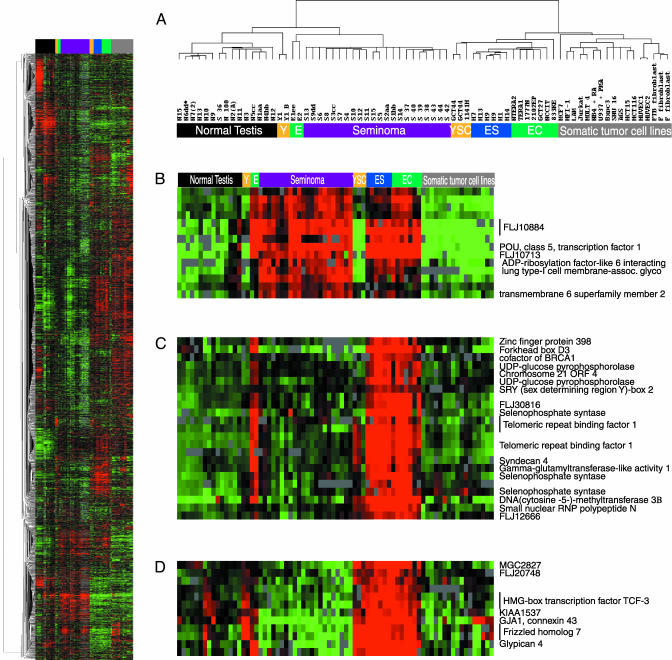
Remarkably little is known about the transcriptional profiles of human embryonic stem (ES) cells or the molecular mechanisms that underlie their pluripotency. To identify commonalties among the transcriptional profiles of different human pluripotent cells and to search for clues into the genesis of human germ cell tumors, we compared the expression profiles of human ES cell lines, human germ cell tumor cell lines and tumor samples, somatic cell lines, and testicular tissue samples by using cDNA microarray analysis. Hierarchical cluster analysis of gene expression profiles showed that the five independent human ES cell lines clustered tightly together, reflecting highly similar expression profiles. The gene expression patterns of human ES cell lines showed many similarities with the human embryonal carcinoma cell samples and more distantly with the seminoma samples. We identified 895 genes that were expressed at significantly greater levels in human ES and embryonal carcinoma cell lines than in control samples. These genes are candidates for involvement in the maintenance of a pluripotent, undifferentiated phenotype.


Figures

Fig. 1.
Fig. 1.
Samples of the hierarchical cluster analysis of 9,976 cDNA clones that were expressed at least 3-fold different from the mean expression values across all of the samples in at least four different arrays. The colors indicates the relative expression levels of each gene, with red indicating positive expression above reference and green indicating negative expression below the reference. (A) The dendrogram represents the relationship of the expression patterns. The lengths of the arms are proportional to the similarities of the expression patterns, with shorter arms indicating closer relationships. (B) Cluster of genes surrounding POU5F1. These genes are highly expressed in ES and EC cells and seminomas but not YSCs and other differentiated tissue types. (C) Cluster of genes highly expressed in ES and EC cells but not seminomas, YSCs, or other differentiated tissues. (D) Cluster of genes including members of Wnt-β-catenin pathway expressed in ES and EC cells and YSCs. See Table 5, which is published as supporting information on the PNAS web site, or http://microarray-pubs.stanford.edu/es_cells_2/supplement.shtml for a complete list of the genes.
Fig. 2.
Fig. 2.
Chromosomal distribution of genes expressed significantly differently in ES cell lines than in EC cells. Genes expressed significantly higher in ES cell lines (black) relative to EC cell lines and in EC cell lines (gray) relative to ES cell lines were determined by direct comparison using SAM. The chromosomal location of each unique gene was retrieved from April 2003 freeze Golden Path (http://genome.ucsc.edu). The distribution of genes on the chromosomes is expressed as the ratio of the number genes per chromosome in the subset to the number of genes per chromosome in the starting microarray set illustrated in Fig. 1. Chromosome 12 in EC cells is significantly different from expected [hypergeometric test (P < 0.00001)].

References

    1. Evans, M. J. & Kaufman, M. H. (1981) Nature 292, 154-156. - PubMed
    1. Martin, G. R. (1981) Proc. Natl. Acad. Sci. USA 78, 7634-7638. - PMC - PubMed
    1. Scholer, H. R., Balling, R., Hatzopoulos, A. K., Suzuki, N. & Gruss, P. (1989) EMBO J. 8, 2551-2557. - PMC - PubMed
    1. Nichols, J., Zevnik, B., Anastassiadis, K., Niwa, H., Klewe-Nebenius, D., Chambers, I., Scholer, H. & Smith, A. (1998) Cell 95, 379-391. - PubMed
    1. Boiani, M., Eckardt, S., Scholer, H. R. & McLaughlin, K. J. (2002) Genes Dev. 16, 1209-1219. - PMC - PubMed

Publication types

MeSH terms