

A panoramic view of gene expression in the human kidney
- PMID: 14595018
- PMCID: PMC263878
- DOI: 10.1073/pnas.2234604100
A panoramic view of gene expression in the human kidney
Abstract
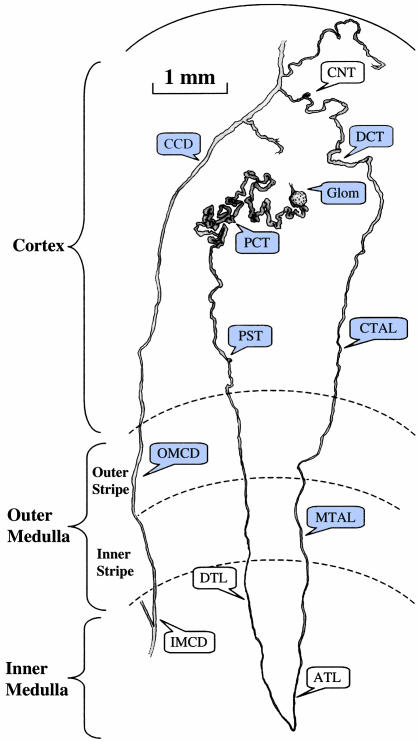
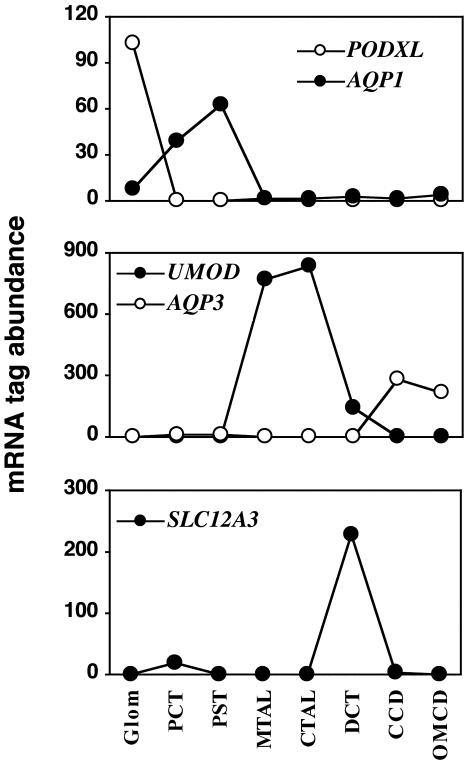
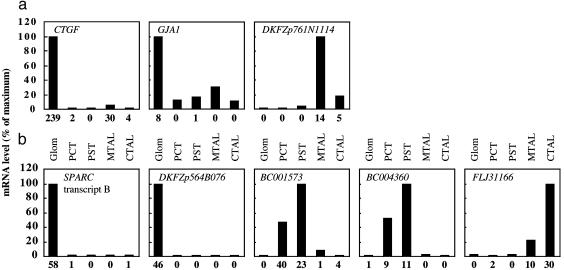
To gain a molecular understanding of kidney functions, we established a high-resolution map of gene expression patterns in the human kidney. The glomerulus and seven different nephron segments were isolated by microdissection from fresh tissue specimens, and their transcriptome was characterized by using the serial analysis of gene expression (SAGE) method. More than 400,000 mRNA SAGE tags were sequenced, making it possible to detect in each structure transcripts present at 18 copies per cell with a 95% confidence level. Expression of genes responsible for nephron transport and permeability properties was evidenced through transcripts for 119 solute carriers, 84 channels, 43 ion-transport ATPases, and 12 claudins. Searching for differences between the transcriptomes, we found 998 transcripts greatly varying in abundance from one nephron portion to another. Clustering analysis of these transcripts evidenced different extents of similarity between the nephron portions. Approximately 75% of the differentially distributed transcripts corresponded to cDNAs of known or unknown function that are accurately mapped in the human genome. This systematic large-scale analysis of individual structures of a complex human tissue reveals sets of genes underlying the function of well-defined nephron portions. It also provides quantitative expression data for a variety of genes mutated in hereditary diseases and helps in sorting candidate genes for renal diseases that affect specific portions of the human nephron.
Figures

References
-
- Abramow, M. & Dratwa, M. (1974) Nature 250, 492-493. - PubMed
-
- Lifton, R. P., Gharavi, A. G. & Geller, D. S. (2001) Cell 104, 545-556. - PubMed
-
- International Human Genome Sequencing Consortium. (2001) Nature 409, 860-921. - PubMed
-
- Venter, J. C., Adams, M. D., Myers, E. W., Li, P. W., Mural, R. J., Sutton, G. G., Smith, H. O., Yandell, M., Evans, C. A., Holt, R. A., et al. (2001) Science 291, 1304-1351. - PubMed
Publication types
MeSH terms
Substances
Associated data
- Actions
LinkOut - more resources
Full Text Sources
Other Literature Sources
Molecular Biology Databases
