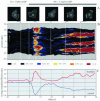
Uniform cAMP stimulation of Dictyostelium cells induces localized patches of signal transduction and pseudopodia
- PMID: 14595105
- PMCID: PMC284803
- DOI: 10.1091/mbc.e03-08-0566
Uniform cAMP stimulation of Dictyostelium cells induces localized patches of signal transduction and pseudopodia
Abstract
The chemoattractant cAMP induces the translocation of cytosolic PHCrac-GFP to the plasma membrane. PHCrac-GFP is a green fluorescent protein fused to a PH domain that presumably binds to phosphatydylinositol polyphosphates in the membrane. We determined the relative concentration of PHCrac-GFP in the cytosol and at different places along the cell boundary. In cells stimulated homogeneously with 1microM cAMP we observed two distinct phases of PHCrac-GFP translocation. The first translocation is transient and occurs to nearly the entire boundary of the cell; the response is maximal at 6-8 s after stimulation and disappears after approximately 20 s. A second translocation of PHCrac-GFP starts after approximately 30 s and persists as long as cAMP remains present. Translocation during this second response occurs to small patches with radius of approximately 4-5 microm, each covering approximately 10% of the cell surface. Membrane patches of PHCrac-GFP are both temporally and spatially closely associated with pseudopodia, which are extended at approximately 10 s from the area with a PHCrac-GFP patch. These signaling patches in pseudopodia of homogeneously stimulated cells resemble the single patch of PHCrac-GFP at the leading edge of a cell in a gradient of cAMP, suggesting that PHCrac-GFP is a spatial cue for pseudopod formation also in uniform cAMP.
Figures


Similar articles
-
Distinct roles of PI(3,4,5)P3 during chemoattractant signaling in Dictyostelium: a quantitative in vivo analysis by inhibition of PI3-kinase.Mol Biol Cell. 2006 Apr;17(4):1503-13. doi: 10.1091/mbc.e05-09-0825. Epub 2006 Jan 18. Mol Biol Cell. 2006. PMID: 16421252 Free PMC article.
-
Sensitization of Dictyostelium chemotaxis by phosphoinositide-3-kinase-mediated self-organizing signalling patches.J Cell Sci. 2004 Jun 15;117(Pt 14):2925-35. doi: 10.1242/jcs.01143. Epub 2004 May 25. J Cell Sci. 2004. PMID: 15161938
-
Locally controlled inhibitory mechanisms are involved in eukaryotic GPCR-mediated chemosensing.J Cell Biol. 2007 Jul 2;178(1):141-53. doi: 10.1083/jcb.200611096. J Cell Biol. 2007. PMID: 17606871 Free PMC article.
-
Forty-five years of cGMP research in Dictyostelium: understanding the regulation and function of the cGMP pathway for cell movement and chemotaxis.Mol Biol Cell. 2021 Oct 1;32(20):ar8. doi: 10.1091/mbc.E21-04-0171. Epub 2021 Aug 4. Mol Biol Cell. 2021. PMID: 34347507 Free PMC article. Review.
-
Is there a pilot in a pseudopod?Eur J Cell Biol. 2006 Sep;85(9-10):915-24. doi: 10.1016/j.ejcb.2006.05.002. Epub 2006 Jun 14. Eur J Cell Biol. 2006. PMID: 16781010 Review.
Cited by
-
Distinct roles of PI(3,4,5)P3 during chemoattractant signaling in Dictyostelium: a quantitative in vivo analysis by inhibition of PI3-kinase.Mol Biol Cell. 2006 Apr;17(4):1503-13. doi: 10.1091/mbc.e05-09-0825. Epub 2006 Jan 18. Mol Biol Cell. 2006. PMID: 16421252 Free PMC article.
-
A bistable model of cell polarity.PLoS One. 2012;7(2):e30977. doi: 10.1371/journal.pone.0030977. Epub 2012 Feb 23. PLoS One. 2012. PMID: 22383986 Free PMC article.
-
Two complementary, local excitation, global inhibition mechanisms acting in parallel can explain the chemoattractant-induced regulation of PI(3,4,5)P3 response in dictyostelium cells.Biophys J. 2004 Dec;87(6):3764-74. doi: 10.1529/biophysj.104.045484. Epub 2004 Oct 1. Biophys J. 2004. PMID: 15465874 Free PMC article.
-
3'-phosphoinositides regulate the coordination of speed and accuracy during chemotaxis.Biophys J. 2008 Oct;95(8):4057-67. doi: 10.1529/biophysj.108.130179. Epub 2008 Aug 1. Biophys J. 2008. PMID: 18676656 Free PMC article.
-
Eukaryotic chemotaxis.Wiley Interdiscip Rev Syst Biol Med. 2009 Jul-Aug;1(1):141-149. doi: 10.1002/wsbm.28. Wiley Interdiscip Rev Syst Biol Med. 2009. PMID: 20648241 Free PMC article.
References
-
- Chung, C.Y., Funamoto, S., and Firtel, R.A. (2001). Signaling pathways controlling cell polarity and chemotaxis. Trends Biochem. Sci. 26, 557-566. - PubMed
-
- Funamoto, S., Meili, R., Lee, S., Parry, L., and Firtel, R.A. (2002). Spatial and temporal regulation of 3-phosphoinositides by PI 3-kinase and PTEN mediates chemotaxis. Cell 109, 611-623. - PubMed
Publication types
MeSH terms
Substances
LinkOut - more resources
Full Text Sources

