. 2004 Feb;15(2):532-42.
doi: 10.1091/mbc.e03-07-0521. Epub 2003 Oct 31.

Unique and redundant roles for HOG MAPK pathway components as revealed by whole-genome expression analysis

Affiliations

Unique and redundant roles for HOG MAPK pathway components as revealed by whole-genome expression analysis

Sean M O'Rourke et al. Mol Biol Cell. 2004 Feb.

Abstract

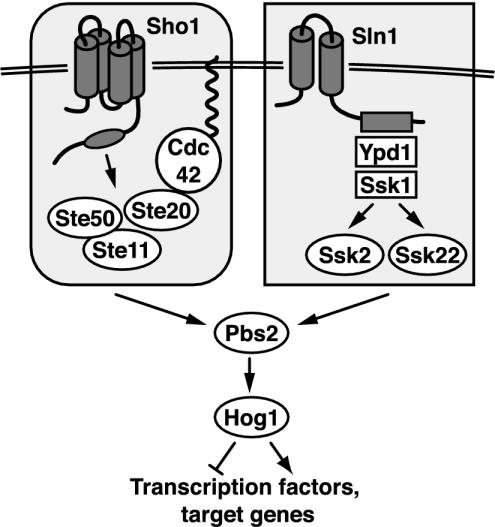
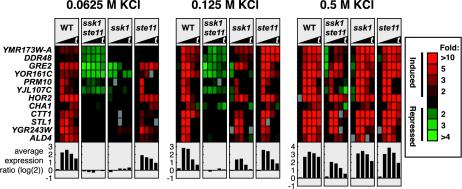
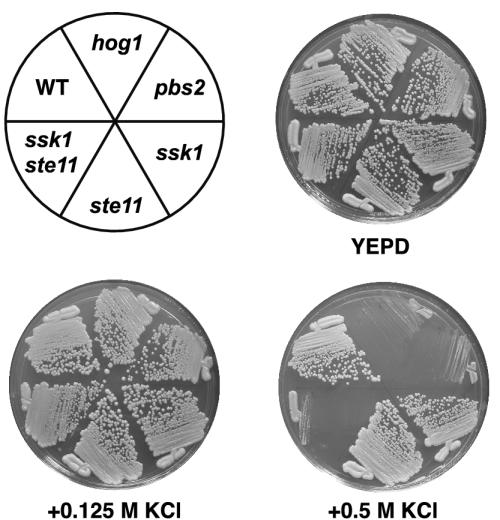
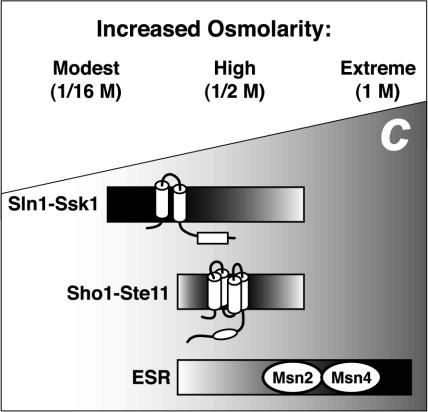
The Saccharomyces cerevisiae high osmolarity glycerol (HOG) mitogen-activated protein kinase pathway is required for osmoadaptation and contains two branches that activate a mitogen-activated protein kinase (Hog1) via a mitogen-activated protein kinase kinase (Pbs2). We have characterized the roles of common pathway components (Hog1 and Pbs2) and components in the two upstream branches (Ste11, Sho1, and Ssk1) in response to elevated osmolarity by using whole-genome expression profiling. Several new features of the HOG pathway were revealed. First, Hog1 functions during gene induction and repression, cross talk inhibition, and in governing the regulatory period. Second, the phenotypes of pbs2 and hog1 mutants are identical, indicating that the sole role of Pbs2 is to activate Hog1. Third, the existence of genes whose induction is dependent on Hog1 and Pbs2 but not on Ste11 and Ssk1 suggests that there are additional inputs into Pbs2 under our inducing conditions. Fourth, the two upstream pathway branches are not redundant: the Sln1-Ssk1 branch has a much more prominent role than the Sho1-Ste11 branch for activation of Pbs2 by modest osmolarity. Finally, the general stress response pathway and both branches of the HOG pathway all function at high osmolarity. These studies demonstrate that cells respond to increased osmolarity by using different signal transduction machinery under different conditions.


Figures

Figure 1.
Figure 1.
Model of the yeast hyperosmotic-response MAPK pathway. See INTRODUCTION for details.
Figure 2.
Figure 2.
Identification of high osmolarity-regulated genes. DNA microarrays containing yeast open reading frames were used to assay gene expression in wild-type yeast (IH4506) treated with 0.5 M KCl or 1 M sorbitol. ORF microarrays were cohybridized with two samples: one derived from treated yeast and one derived from an untreated wild-type strain growing in normal osmolarity YEPD medium. Only genes that were regulated twofold or more in at least two time points in either the KCl or sorbitol time course were included. Osmolarity-regulated genes were defined as induced or repressed according to their position determined by hierarchical clustering (our unpublished data). (A) Example of the output of hierarchical clustering. Red color indicates increased mRNA abundance and green indicates decreased mRNA abundance (relative to the untreated reference culture). The solid black triangles in this and subsequent figures indicate increasing time of treatment, here from 0 to 180 min (0, 5, 10, 20, 30, 40, 60, 90, 120, 180 min). (B) The average fold change of mRNA levels is displayed as a plot for 488 osmoinduced and 1789 osmorepressed genes. Solid squares represent the average magnitude of regulation by 0.5 M KCl; open squares represent the average magnitude of regulation by 1 M sorbitol. (C) The number of induced and repressed genes is plotted according to their time point of maximal regulation for 0.5 M KCl (black bars) or 1 M sorbitol (open bars) treatments (genes as in B).
Figure 3.
Figure 3.
Identification of 579 genes dependent on Hog1 for normal regulation. Genes are displayed which showed at least a twofold change in expression (at two or more time points) in either wild-type (IH4506) or hog1 (IH4553) strains treated with 0.5 M KCl and which showed at least two occurrences of a threefold difference (increased or decreased) between wild-type and hog1 strains. Six clusters were identified based on gene expression patterns and dependence on Hog1. The left-most three cluster diagrams represent gene expression values in the wild-type strain treated with 0.5 M KCl (0-180 min), the hog1 strain treated with 0.5 M KCl (0-180 min), and the wild-type strain treated with 38.5 μM α-factor (10-40 min). Samples were taken at intervals as in Figure 2 for the cultures treated with KCl and at 10-min intervals for the culture treated with α-factor. The two right-most cluster diagrams are expanded views of selected areas showing gene expression in wild-type and hog1 strains treated with 0.5 M KCl. Average gene expression plots of all genes within the expanded clusters shown on the far right further illustrate the various ways in which Hog1 influences gene expression.
Figure 4.
Figure 4.
Expression pattern of 296 genes that show altered expression in response to 0.5 M KCl in the absence of various HOG pathway components. Gene expression (green/red) is as in Figure 3 and Me ratio (yellow/blue) as described previously (O'Rourke and Herskowitz, 2002). Genes displayed here were those that satisfied two criteria: 1) an Me ratio of >3 or <0.333 for any two time points in any strain, and 2) induction or repression in at least two time points more than twofold in any individual strain treated with 0.5 M KCl. Gene expression values and corresponding Me ratios are displayed for samples taken at 0, 10, 20, 30, and 40 min. For clarity, the Me ratio is displayed in color only if it is >3 or <0.333. The number of genes that exhibited altered expression in each time series, as defined by the above-mentioned criteria are hog1, 145; pbs2, 162; ssk1 ste11, 133; ssk1 sho1, 75; ste11, 20; ssk1, 8; and sho1, 5. We compared expression of these 296 genes in four different wild-type time series and found that between one and three genes varied significantly between the different time series, which serves as a baseline for false-positive detection. Hierarchical clustering of the data defined three main clusters, denoted here as osmoinduced, osmorepressed, and cross-talk. Strains were wild-type (IH4506), hog1 (IH4553), pbs2 (IH4522), ssk1 ste11 (IH4531), ssk1 sho1 (IH4514), ste11 (IH4537), ssk1 (IH4508), and sho1 (IH4510).
Figure 5.
Figure 5.
Redundancy and nonredundancy of the Sho1-Ste11 and Sln1-Ssk1 branches at different osmolarities. Genes that exhibited severe induction defects in response to different concentrations of KCl are displayed. The genes shown exhibited alterations in regulation at two or more time points by a factor of at least threefold in any mutant strain and showed induction in the wild-type strain. For conciseness, only 12 of 98 genes are displayed. Samples were taken at 0, 5, 10, 20, and 30 min. The plots below the gene display show the average fold induction [in log(2) scale] of the genes shown. Wild-type (IH4506), ssk1 ste11 (IH4531), ssk1 (IH4508), and ste11 (IH4537) strains were used.
Figure 6.
Figure 6.
Growth on high-osmolarity media. Strains were streaked onto the indicated media and photographed after 48 h of growth at 30°C. Strains as in Figure 4.
Figure 7.
Figure 7.
Different hyperosmotic conditions trigger different response pathways. C, concentration of solute shown increasing from left to right. The environmental stress response (ESR) pathway is preferentially used during extreme osmotic stress (Gasch et al., 2000). The Sln1-Ssk1 branch of the HOG pathway but not the Sho1-Ste11 branch is used during modest osmotic stress. At intermediate hyperosmotic stress, the ESR, Sln1-Ssk1, and Sho1-Ste11 pathways each contribute significantly to changes in gene expression.

References

    1. Alepuz, P.M., Jovanovic, A., Reiser, V., and Ammerer, G. (2001). Stress-induced map kinase Hog1 is part of transcription activation complexes. Mol. Cell 7, 767-777. - PubMed
    1. Bilsland-Marchesan, E., Arino, J., Saito, H., Sunnerhagen, P., and Posas, F. (2000). Rck2 kinase is a substrate for the osmotic stress-activated mitogen-activated protein kinase Hog1. Mol. Cell. Biol. 20, 3887-3895. - PMC - PubMed
    1. Brewster, J.L., de Valoir, T., Dwyer, N.D., Winter, E., and Gustin, M.C. (1993). An osmosensing signal transduction pathway in yeast. Science 259, 1760-1763. - PubMed
    1. Causton, H.C., Ren, B., Koh, S.S., Harbison, C.T., Kanin, E., Jennings, E.G., Lee, T.I., True, H.L., Lander, E.S., and Young, R.A. (2001). Remodeling of yeast genome expression in response to environmental changes. Mol. Biol. Cell 12, 323-337. - PMC - PubMed
    1. Cullen, P.J., Schultz, J., Horecka, J., Stevenson, B.J., Jigami, Y., and Sprague, G.F., Jr. (2000). Defects in protein glycosylation cause SHO1-dependent activation of a STE12 signaling pathway in yeast. Genetics 155, 1005-1018. - PMC - PubMed

Publication types

MeSH terms

Substances