

Inter-rater reliability of nursing home quality indicators in the U.S
- PMID: 14596684
- PMCID: PMC280691
- DOI: 10.1186/1472-6963-3-20
Inter-rater reliability of nursing home quality indicators in the U.S
Abstract
Background: In the US, Quality Indicators (QI's) profiling and comparing the performance of hospitals, health plans, nursing homes and physicians are routinely published for consumer review. We report the results of the largest study of inter-rater reliability done on nursing home assessments which generate the data used to derive publicly reported nursing home quality indicators.
Methods: We sampled nursing homes in 6 states, selecting up to 30 residents per facility who were observed and assessed by research nurses on 100 clinical assessment elements contained in the Minimum Data Set (MDS) and compared these with the most recent assessment in the record done by facility nurses. Kappa statistics were generated for all data items and derived for 22 QI's over the entire sample and for each facility. Finally, facilities with many QI's with poor Kappa levels were compared to those with many QI's with excellent Kappa levels on selected characteristics.
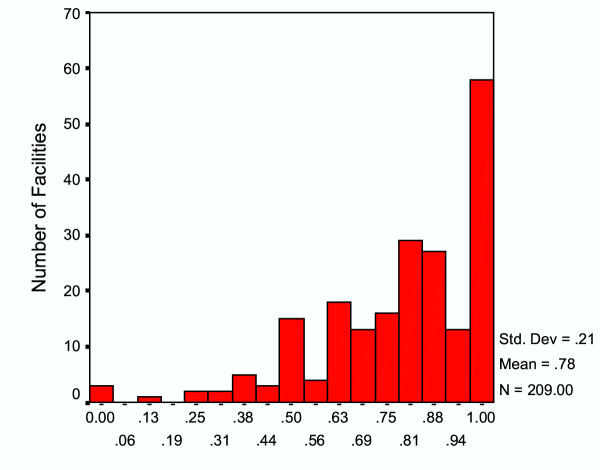
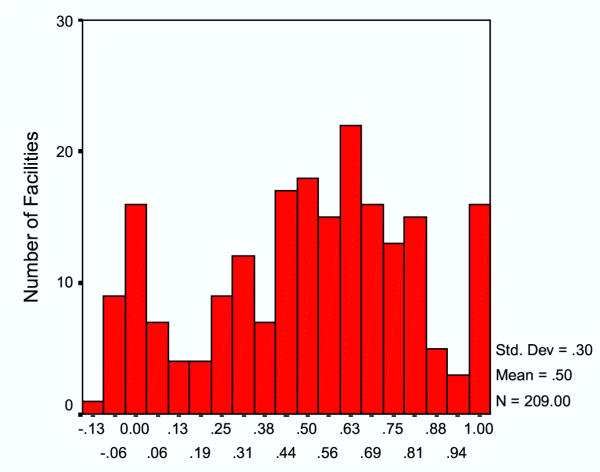
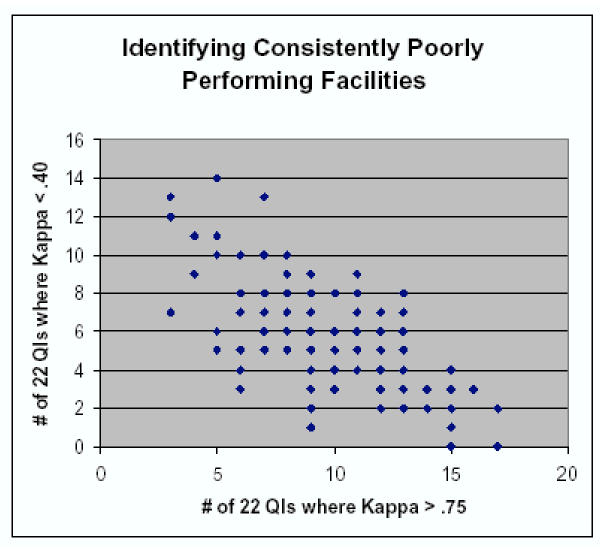
Results: A total of 462 facilities in 6 states were approached and 219 agreed to participate, yielding a response rate of 47.4%. A total of 5758 residents were included in the inter-rater reliability analyses, around 27.5 per facility. Patients resembled the traditional nursing home resident, only 43.9% were continent of urine and only 25.2% were rated as likely to be discharged within the next 30 days. Results of resident level comparative analyses reveal high inter-rater reliability levels (most items >.75). Using the research nurses as the "gold standard", we compared composite quality indicators based on their ratings with those based on facility nurses. All but two QI's have adequate Kappa levels and 4 QI's have average Kappa values in excess of.80. We found that 16% of participating facilities performed poorly (Kappa <.4) on more than 6 of the 22 QI's while 18% of facilities performed well (Kappa >.75) on 12 or more QI's. No facility characteristics were related to reliability of the data on which Qis are based.
Conclusion: While a few QI's being used for public reporting have limited reliability as measured in US nursing homes today, the vast majority of QI's are measured reliably across the majority of nursing facilities. Although information about the average facility is reliable, how the public can identify those facilities whose data can be trusted and whose cannot remains a challenge.
Figures
References
-
- Jencks SF. The government's role in hospital accountability for quality of care. Jt Comm J Qual Improv. 1994;20:364–369. - PubMed
Publication types
MeSH terms
LinkOut - more resources
Full Text Sources
Medical
Research Materials
Miscellaneous
