

Toward rigorous comprehension of biological complexity: modeling, execution, and visualization of thymic T-cell maturation
- PMID: 14597657
- PMCID: PMC403768
- DOI: 10.1101/gr.1215303
Toward rigorous comprehension of biological complexity: modeling, execution, and visualization of thymic T-cell maturation
Erratum in
- Genome Res. 2004 Jan;14(1):197
Abstract
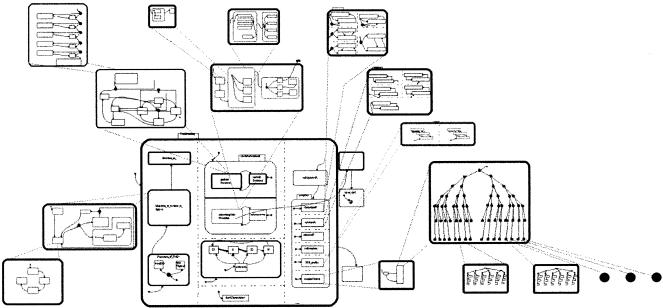
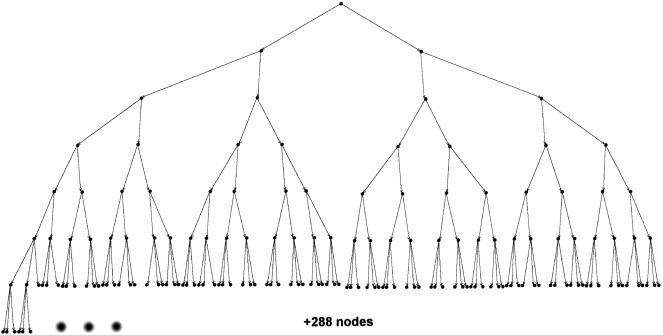
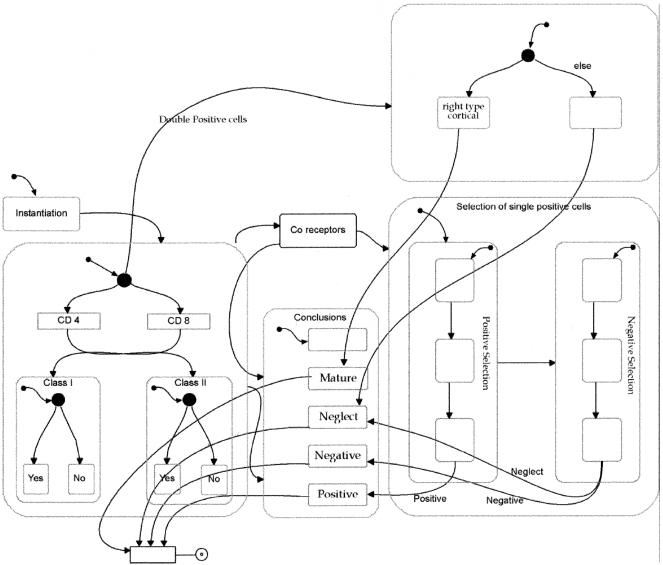
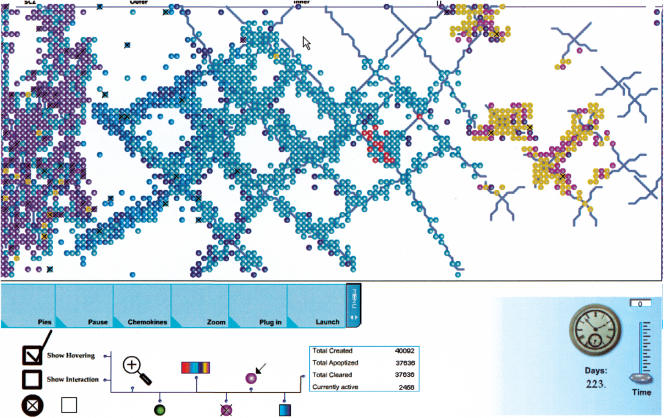
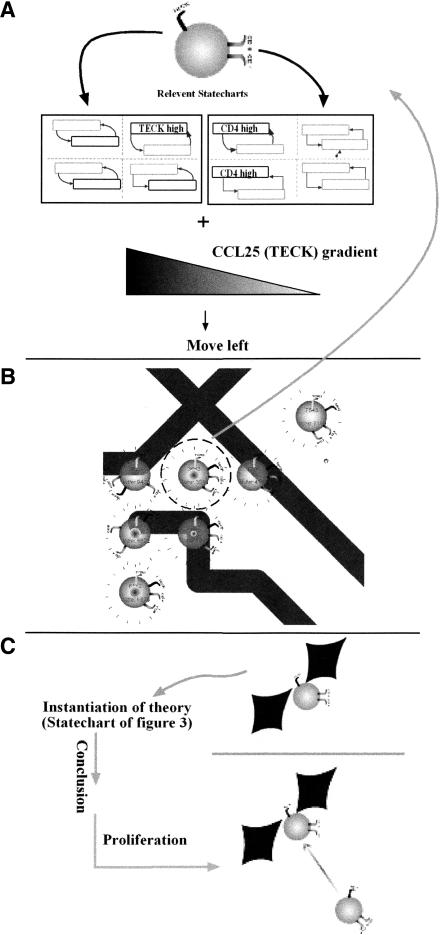
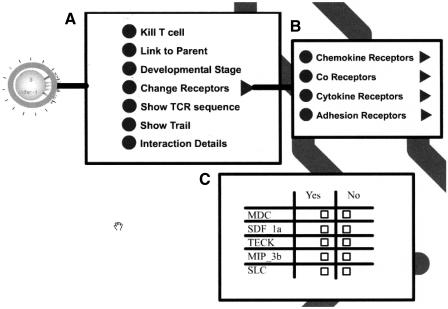
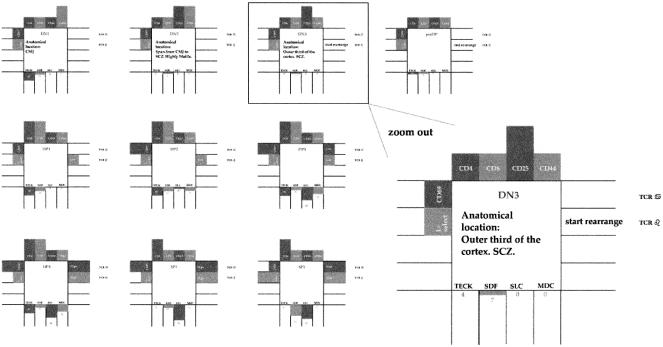
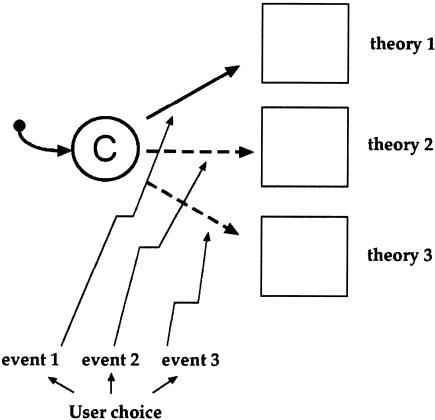
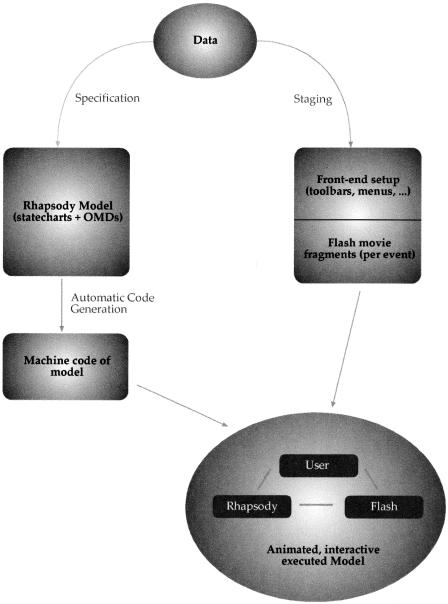
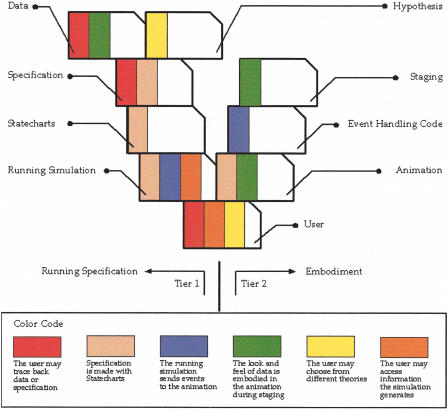
One of the problems biologists face is a data set too large to comprehend in full. Experimenters generate data at an ever-growing pace, each from their own niche of interest. Current theories are each able, at best, to capture and model only a small part of the data. We aim to develop a general approach to modeling that will help broaden biological understanding. T-cell maturation in the thymus is a telling example of the accumulation of experimental data into a large disconnected data set. The thymus is responsible for the maturation of stem cells into mature T cells, and its complexity divides research into different fields, for example, cell migration, cell differentiation, histology, electron microscopy, biochemistry, molecular biology, and more. Each field forms its own viewpoint and its own set of data. In this study we present the results of a comprehensive integration of large parts of this data set. The integration is performed in a two-tiered visual manner. First, we use the visual language of Statecharts, which makes specification precise, legible, and executable on computers. We then set up a moving graphical interface that dynamically animates the cells, their receptors, the different gradients, and the interactions that constitute thymic maturation. This interface also provides a means for interacting with the simulation.
Figures
Similar articles
-
Development of functional thymic epithelial cells occurs independently of lymphostromal interactions.Mech Dev. 2005 Dec;122(12):1294-9. doi: 10.1016/j.mod.2005.08.003. Epub 2005 Aug 29. Mech Dev. 2005. PMID: 16274965
-
Reinterpreting recent thymic emigrant function: defective or adaptive?Curr Opin Immunol. 2018 Apr;51:1-6. doi: 10.1016/j.coi.2017.12.006. Epub 2017 Dec 16. Curr Opin Immunol. 2018. PMID: 29257954 Free PMC article. Review.
-
Thymic epithelial progenitor cells and thymus regeneration: an update.Cell Res. 2007 Jan;17(1):50-5. doi: 10.1038/sj.cr.7310114. Cell Res. 2007. PMID: 17146450 Review.
-
Entry into the thymic microenvironment triggers Notch activation in the earliest migrant T cell progenitors.J Immunol. 2003 Feb 1;170(3):1299-303. doi: 10.4049/jimmunol.170.3.1299. J Immunol. 2003. PMID: 12538689
-
Lymphostromal interactions in thymic development and function.Nat Rev Immunol. 2001 Oct;1(1):31-40. doi: 10.1038/35095500. Nat Rev Immunol. 2001. PMID: 11905812 Review.
Cited by
-
Explaining a complex living system: dynamics, multi-scaling and emergence.J R Soc Interface. 2007 Apr 22;4(13):175-82. doi: 10.1098/rsif.2006.0173. J R Soc Interface. 2007. PMID: 17251153 Free PMC article. Review.
-
An Interactive Tool for Animating Biology, and Its Use in Spatial and Temporal Modeling of a Cancerous Tumor and Its Microenvironment.PLoS One. 2015 Jul 20;10(7):e0133484. doi: 10.1371/journal.pone.0133484. eCollection 2015. PLoS One. 2015. PMID: 26191814 Free PMC article.
-
Logic programming to predict cell fate patterns and retrodict genotypes in organogenesis.J R Soc Interface. 2014 Sep 6;11(98):20140245. doi: 10.1098/rsif.2014.0245. J R Soc Interface. 2014. PMID: 24966232 Free PMC article.
-
Towards early diagnosis of Alzheimer's disease: advances in immune-related blood biomarkers and computational approaches.Front Immunol. 2024 Apr 23;15:1343900. doi: 10.3389/fimmu.2024.1343900. eCollection 2024. Front Immunol. 2024. PMID: 38720902 Free PMC article. Review.
-
Computational insights into Caenorhabditis elegans vulval development.Proc Natl Acad Sci U S A. 2005 Feb 8;102(6):1951-6. doi: 10.1073/pnas.0409433102. Epub 2005 Jan 31. Proc Natl Acad Sci U S A. 2005. PMID: 15684055 Free PMC article.
References
-
- Anderson, G. and Jenkinson, E.J. 2001. Lymphostromal interactions in thymic development and function. Nat. Rev. Immunol. 1: 31-40. - PubMed
-
- Annunziato, F., Romagnani, P., Cosmi, L., Lazzeri, E., and Romagnani, S. 2001. Chemokines and lymphopoiesis in human thymus. Trends Immunol. 22: 277-281. - PubMed
-
- Bergmann, C., van Hemmen, J.L., and Segel, L.A. 2002. How instruction and feedback can select the appropriate T helper response. Bull. Math. Biol. 64: 425-446. - PubMed
-
- Bleul, C.C. and Boehm, T. 2000. Chemokines define distinct microenvironments in the developing thymus. Eur. J. Immunol. 30: 3371-3379. - PubMed
-
- Campbell, J.J., Pan, J., and Butcher, E.C. 1999. Cutting edge: Developmental switches in chemokine responses during T cell maturation. J. Immunol. 163: 2353-2357. - PubMed
Publication types
MeSH terms
LinkOut - more resources
Full Text Sources
Other Literature Sources