. 2003 Nov 1;17(21):2688-97.
doi: 10.1101/gad.1140003.

An mRNA structure in bacteria that controls gene expression by binding lysine

Affiliations

An mRNA structure in bacteria that controls gene expression by binding lysine

Narasimhan Sudarsan et al. Genes Dev. .

Abstract

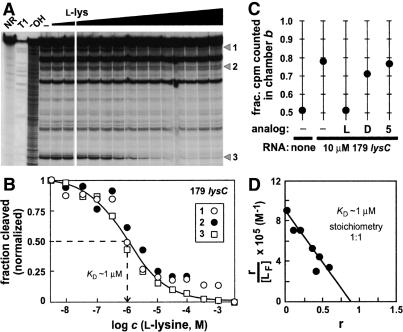
Riboswitches are metabolite-responsive genetic control elements that reside in the untranslated regions (UTRs) of certain messenger RNAs. Herein, we report that the 5'-UTR of the lysC gene of Bacillus subtilis carries a conserved RNA element that serves as a lysine-responsive riboswitch. The ligand-binding domain of the riboswitch binds to L-lysine with an apparent dissociation constant (KD) of approximately 1 micro M, and exhibits a high level of molecular discrimination against closely related analogs, including D-lysine and ornithine. Furthermore, we provide evidence that this widespread class of riboswitches serves as a target for the antimetabolite S-(2-aminoethyl)-L-cysteine (AEC). These findings add support to the hypotheses that direct sensing of metabolites by messenger RNAs is a fundamental form of genetic control and that riboswitches represent a new class of antimicrobial drug targets.


Figures

Figure 1.
Figure 1.
The L box, a highly conserved sequence and structural domain, is present in the 5′-UTRs of Gram-positive and Gram-negative bacterial mRNAs that are related to lysine metabolism. Conserved portions of the L-box sequence and secondary structure were identified by alignment of 32 representative mRNAs as noted. Base-pairing potential representing P1-P5 are individually colored. Nucleotides in red are conserved in >80% of the examples. The asterisk identifies the representative (B. subtilis lysC 5′-UTR) that was examined in this study. Gene names are as annotated in GenBank or were derived by protein sequence similarity. Organism abbreviations are as follows: (BA) Bacillus anthracis; (BH) Bacillus halodurans; (BS) Bacillus subtilis; (BX) Bacillus sp.; (CA) Clostridium acetobutylicum; (CP) Clostridium perfringens; (EC) Escherichia coli; (HI) Haemophilus influenzae; (OI) Oceanobacillus iheyensis; (PM) Pasteurella multocida; (SA) Staphylococcus aureus; (SE) Staphylococcus epidermidis; (SF) Shigella flexneri; (SO) Shewanella oneidensis; (TM) Thermatoga maritima; (TT) Thermoanaerobacter tengcongensis; (VC) Vibrio cholerae; (VV) Vibrio vulnificus.
Figure 2.
Figure 2.
The consensus L-box motif from the lysC 5′-UTR of B. subtilis undergoes allosteric rearrangement in the presence of L-lysine. (A) Consensus sequence and structure of the L-box domain as derived by using a phylogeny of 32 representative sequences from prokaryotic organisms (Fig. 1). Nucleotides depicted in red are present in at least 80% of the representatives, open circles identify nucleotide positions of variable identity, and tan lines denote variable nucleotide identity and chain length. (B) Sequence, secondary structure model, and lysine-induced structural modulation of the lysC 5′-UTR of B. subtilis. An additional 94 nucleotides (not depicted) reside between nucleotide 237 and the AUG start codon. Structural modulation sites (red-encircled nucleotides) were established by using 237 lysC RNA by monitoring spontaneous RNA cleavage, as depicted in C. (C) In-line probing of the 237 lysC RNA reveals lysine-induced modulation of RNA structure. Patterns of spontaneous cleavage, revealed by product separation using denaturing 10% PAGE, are altered at four major sites (denoted 1-4) in the presence (+) of 10 µM L-lysine (L) relative to that observed in the absence (-) of lysine. (T1) Partial digest with RNase T1; (-OH), partial digest with alkali; (NR) no reaction. Selected bands in the T1 lane (G-specific cleavage) are identified by nucleotide position. See Materials and Methods for experimental details.
Figure 3.
Figure 3.
Molecular recognition characteristics of the lysine aptamer and the use of caged lysine. (A) Chemical structures of L-lysine, D-lysine, and nine closely related analogs. Shaded atoms identify chemical differences between L-lysine and the analog depicted. (B) In-line probing analysis of the 179 lysC RNA in the absence (-) of ligand, or in the presence of 10 µM L-lysine or 100 µM of various analogs as indicated for each lane. For each lane, the relative extent of spontaneous cleavage at site 3 is compared with that of the zone of constant cleavage immediately below this site, in which a cleavage ratio significantly below ∼1.5 reflects modulation. (C) Schematic representation of dipeptide digestion by hydrochloric acid. All dipetide forms are expected to be incapable of binding the lysine aptamer (inactive), whereas lysine-containing dipeptides should induce conformational changes in the aptamer (active) upon acid digestion. (D) In-line probing analysis of the 179 lysC RNA in the absence of lysine (-) or in the presence of various amino acids and dipeptides. Underlined lanes carry dipeptide preparations that were pretreated with HCl, as depicted in A. (E) The fraction of spontaneous cleavage at site 3 in D is plotted after normalization to the extent of processing in the absence of added ligand.
Figure 4.
Figure 4.
Determination of the dissociation constant and stoichiometry for L-lysine binding to the 179 lysC RNA. (A) In-line probing with increasing concentrations of L-lysine ranging from 3 nM to 3 mM. Details are as defined for Figure 2C. (B) Plot depicting the normalized fraction of RNA undergoing spontaneous cleavage versus the concentration of amino acid for sites 1-3. The broken line identifies the concentration of L-lysine required to bring about half-maximal structural modulation, which indicates the apparent KD for ligand binding. (C) The 179 lysC RNA (10 µM) shifts the equilibrium of tritiated L-lysine (50 nM) in an equilibrium dialysis chamber. To investigate competitive binding, unlabeled L-lysine (L), unlabeled D-lysine (D), or L-ornithine (5) was added to a final concentration of 50 µM each to one chamber of a pre-equilibrated assay as indicated. (D) Scatchard analysis of L-lysine binding by the 179 lysC RNA. The variable r represents the ratio of bound ligand concentration versus the total RNA concentration, and the variable [LF] represents the concentration of free ligand.
Figure 5.
Figure 5.
The B. subtilis lysC riboswitch and its mechanism for metabolite-induced transcription termination. (A) Sequence and repressed-state model for the lysC riboswitch secondary structure. The nucleotides highlighted in orange identify the putative antiterminator interaction that could form in the absence of L-lysine. Boxed nucleotides identify sites of disruption (M1) and compensatory mutations for the terminator stem (M2) and for the terminator and antiterminator stems (M3). Nucleotides shaded in light blue identify some of the positions in which mutations exhibit lysC derepression that were reported previously (Vold et al. 1975; Lu et al. 1992). These mutations confer resistance to AEC (inset). (B) Single-round in vitro transcription termination assays conducted in the absence (-) or presence (+) of 10 mM L-lysine or other analogs as indicated. (FL) Full-length transcripts; (T) terminated transcripts. The percent of the terminated RNAs relative to the total terminated and full-length transcripts are provided for each lane (% term.). (C) In vivo expression of a β-galactosidase reporter gene fused to wild-type (WT), G39A, and G40A mutant lysC 5′-UTR fragments. Media conditions are as follows: (I) normal medium (0.27 mM lysine); (II) minimal medium (0.012 mM); (III) lysine-supplemented minimal medium (1 mM); (IV) lysine hydroxamate-supplemented (medium II plus 1 mM lysine hydroxamate) minimal media; (V) AEC-supplemented (medium II plus 1 mM AEC) minimal medium.

References

    1. Belitsky B.R. 2002. Biosynthesis of amino acids of the glutamate and aspartate families, alanine, and polyamines. In Bacillus subtilis and its closest relatives: From genes to cells. (eds. A.L. Sonenshein, et al.), pp. 203-231. ASM Press, Washington, D.C.
    1. Boy E., Borne, F., and Patte, J.C. 1979. Isolation and identification of mutants constitutive for aspartokinase III synthesis in Escherichia coli K12. Biochimie 61: 1151-1160. - PubMed
    1. Di Girolamo M., Busiello, V., Coccia, R., and Foppoli, C. 1990. Aspartokinase III repression and lysine analogs utilization for protein synthesis. Physiol. Chem. Phys. Med. NMR 22: 241-245. - PubMed
    1. Dong Z. 1992. An efficient asymmetric synthesis of L-α-ω-diaminoalkanoic acids. Tetrahedron Lett. 33: 7725-7726.
    1. Engel M.H. and Hare, P.E. 1982. Racemization rates of the basic amino acids. Year Book Carnegie Inst. Washington 81: 422-425.

Publication types

MeSH terms

LinkOut - more resources