. 2003 Nov 11;100(23):13609-14.
doi: 10.1073/pnas.2235843100. Epub 2003 Nov 3.

Aquaporin-4 square array assembly: opposing actions of M1 and M23 isoforms

Affiliations

Aquaporin-4 square array assembly: opposing actions of M1 and M23 isoforms

C Sue Furman et al. Proc Natl Acad Sci U S A. .

Abstract

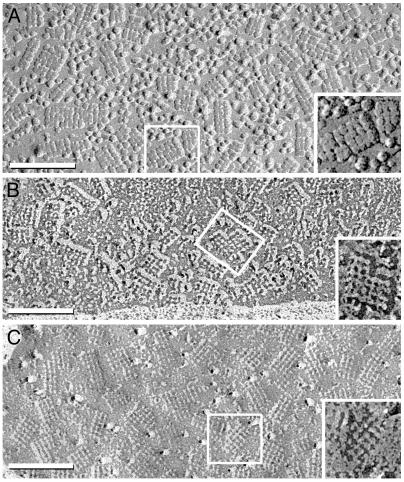
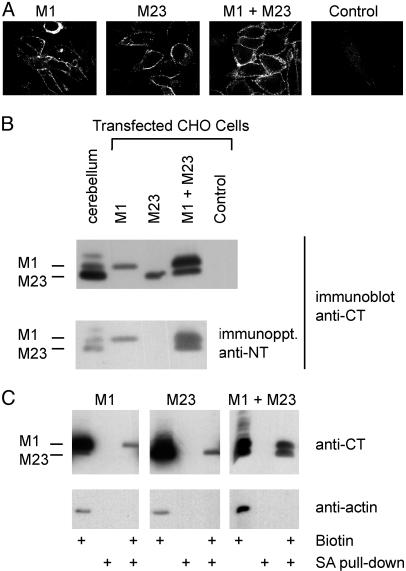
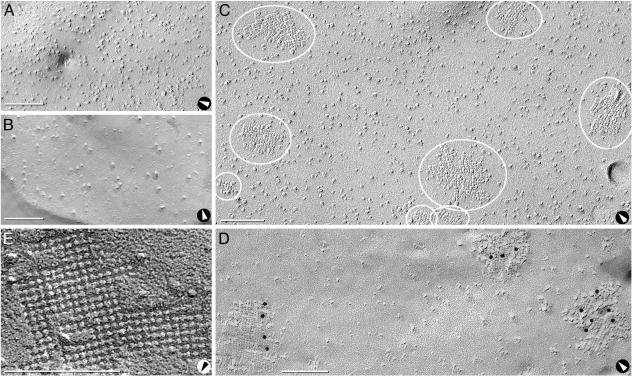
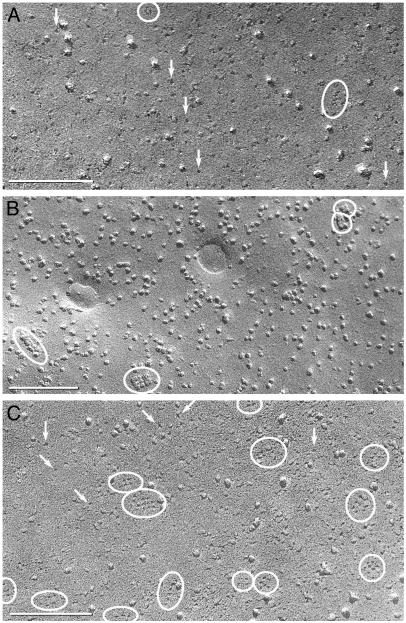
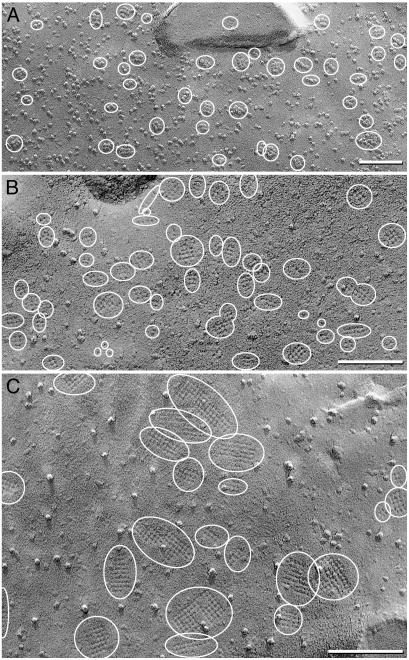
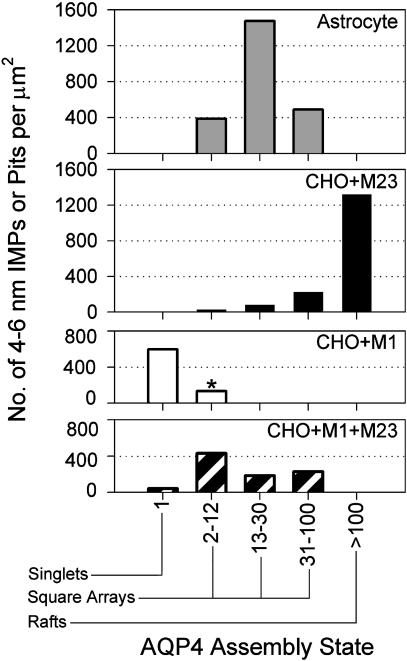
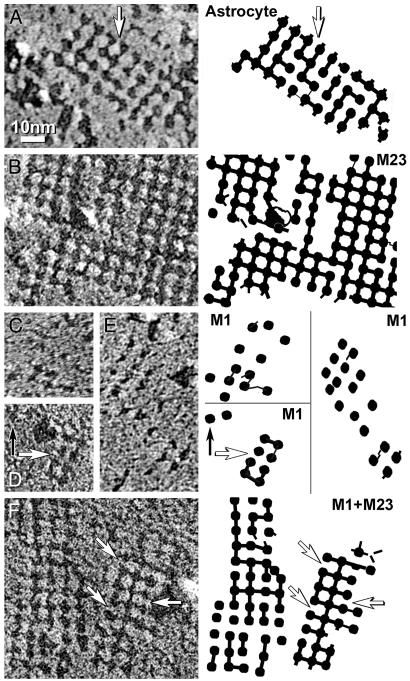
Osmotic homeostasis in the brain involves movement of water through aquaporin-4 (AQP4) membrane channels. Perivascular astrocyte end-feet contain distinctive orthogonal lattices (square arrays) assembled from 4- to 6-nm intramembrane particles (IMPs) corresponding to individual AQP4 tetramers. Two isoforms of AQP4 result from translation initiation at methionine residues M1 and M23, but no functional differences are known. In this study, Chinese hamster ovary cells were transfected with M1, M23, or M1+M23 isoforms, and AQP4 expression was confirmed by immunoblotting, immunocytochemistry, and immunogold labeling. Square array organization was examined by freeze-fracture electron microscopy. In astrocyte end-feet, >90% of 4- to 6-nm IMPs were found in square arrays, with 65% in arrays of 13-30 IMPs. In cells transfected with M23, 95% of 4- to 6-nm IMPs were in large assemblies (rafts), 85% of which contained >100 IMPs. However, in M1 cells, >95% of 4- to 6-nm IMPs were present as singlets, with <5% in incipient arrays of 2-12 IMPs. In M1+M23 cells, 4- to 6-nm IMPs were in arrays of intermediate sizes, resembling square arrays in astrocytes. Structural cross-bridges of 1 x 2 nm linked >90% of IMPs in M23 arrays ( approximately 1,000 cross-bridges per microm2) but were rarely seen in M1 cells. These studies show that M23 and M1 isoforms have opposing effects on intramembrane organization of AQP4: M23 forms large square arrays with abundant cross-bridges; M1 restricts square array assembly.


Figures

Fig. 1.
Fig. 1.
Freeze-fractured astrocyte end-feet membranes in suprachiasmic nucleus from adult rat. (A) The conventional replica has a 2-nm-thick platinum coat and a 1- to 2-nm coat of water vapor (27). Multiple square arrays appear as 6-nm P-face IMPs. (B) In higher-resolution replicas made with ≈1 nm of platinum without detectable water vapor, square arrays consist of 4-nm IMPs linked by 1 × 2 nm cross-bridges. (C) In E-face images, 3- to 4-nm pits are linked by 1 × 2 nm furrows. (Insets) Representative examples are enlarged and printed with black shadows. (Bars = 100 nm.)
Fig. 2.
Fig. 2.
Expression of M1 and M23 isoforms of AQP4 in stably transfected CHO cells. (A) Confocal AQP4 immunofluorescence of cells transfected with M1, M23, M1+M23, or control (empty vector) incubated with anti-CT (reacts with M1 and M23). (×100.) (B Upper) Anti-CT immunoblot of membrane proteins prepared from rat cerebellum or transfected CHO cells (10 μg of protein per lane). (Lower) Solubilized cell lysate immunoprecipitated with anti-NT (specific for N terminus of M1) analyzed by anti-CT immunoblot. (C) Biochemical demonstration of M1 and M23 at the cell surface. Cells were treated with a membrane-impermeant biotinylating agent, precipitated by streptavidin (SA), and analyzed by anti-CT or anti-actin immunoblot (see Materials and Methods).
Fig. 3.
Fig. 3.
Freeze-fractured control CHO cells and cells expressing M23. (A and B) P-face (A) and E-face (B) images of cells transfected with empty vector reveal P-face IMPs and E-face pits of 7- to 9-nm diameter but no square arrays. No 4- to 6-nm-diameter pits were detected. E-faces have fewer IMPs than P-faces (A). (C) P-face image of M23 cell reveals three square arrays (small ovals) and five large rafts, all with 6-nm spacing (large ovals). (D) Anti-CT immunogold labeling of rafts in P-face of M23 cell. (E) High magnification of E-face image of raft in M23 cell. D was from formaldehyde-fixed cells (24), but the other images were from glutaraldehyde-fixed cells. Arrows denote direction of shadowing. (Bars = 100 nm.)
Fig. 4.
Fig. 4.
Freeze-fracture images of cells expressing M1. (A and B) E-face (A) and P-face (B) images reveal abundant 4- to 6-nm pits or IMPs and occasional incipient square arrays with ≤12 pits or IMPs in square lattices with 6-nm spacing (ovals). (C) E-face image of an occasional cell with a larger number of incipient arrays (ovals) and singlet 4- to 6-nm pits (arrows). (Bars = 100 nm.)
Fig. 5.
Fig. 5.
Freeze-fracture images of cells expressing M1 and M23. (A and B) P-face (A) and E-face (B) images reveal multiple small square arrays of up to 20 IMPs or pits in 6-nm spacing (ovals). (C) E-face of occasional cell with larger square arrays of up to 100 pits (ovals). (Bars = 100 nm.)
Fig. 6.
Fig. 6.
Histogram of IMP or pit assembly state in membranes of astrocyte end-feet and CHO cells expressing M23, M1, or M1+M23. Morphometric analyses of P-face and E-face images compiled the number of singlet 4- to 6-nm IMPs or pits, incipient arrays with 2-12 IMPs or pits (*, M1 only), square arrays with 2-12, 13-30, and 31-100 IMPs or pits, and rafts with >100 IMPs or pits. The survey compiled 4- to 6-nm IMPs or pits from astrocytes (1,832 IMPs, 0.52 μm2), M23 cells (1,552 IMPs, 0.94 μm2), M1 cells (252 IMPs, 0.46 μm2), and M1+M23 cells (1,319 IMPs, 1.49 μm2).
Fig. 7.
Fig. 7.
High-magnification E-face images and companion diagrams illustrating 2-nm furrows linking adjacent pits. (A) Astrocyte square arrays with missing furrows (arrow). (B) M23 raft has furrows connecting >90% of pits. (C-E) Incipient arrays in M1 cells have fewer furrows and irregular lattice spacings, ranging from 5 nm to 11 nm. (F) Square array in M1+M23 cell has furrows linking ≈50% of pits. All shadows are from right to left. Companion diagrams denote positions of pits and furrows. Arrows indicate missing furrows. B-E are shadowed at similar local declination angles and at ≈45° azimuth to the orthogonal lattices; each was selected for identical platinum granularity and image resolution. The effects of shadow angle and azimuth on ability to resolve cross-bridges have been described (23). (≈×450,000.)

References

    1. Agre, P., King, L. S., Yasui, M., Guggino, W. B., Ottersen, O. P., Fujiyoshi, Y., Engel, A. & Nielsen, S. (2002) J. Physiol. 542, 3-16. - PMC - PubMed
    1. Lu, M., Lee, M. D., Smith, B. L., Jung, J. S., Agre, P., Verdijk, M. A., Merkx, G., Rijss, J. P. & Deen, P. M. (1996) Proc. Natl. Acad. Sci. USA 93, 10908-10912. - PMC - PubMed
    1. Jung, J. S., Bhat, R. V., Preston, G. M., Guggino, W. B., Baraban, J. M. & Agre, P. (1994) Proc. Natl. Acad. Sci. USA 91, 13052-13056. - PMC - PubMed
    1. Neely, J. D., Christensen, B. M., Nielsen, S. & Agre, P. (1999) Biochemistry 38, 11156-11163. - PubMed
    1. Neely, J. D., Amiry-Moghaddam, M., Ottersen, O. P., Froehner, S. C., Agre, P. & Adams, M. E. (2001) Proc. Natl. Acad. Sci. USA 98, 14108-14113. - PMC - PubMed

Publication types

LinkOut - more resources