. 2003 Nov 11;100(23):13644-9.
doi: 10.1073/pnas.2233464100. Epub 2003 Nov 3.

Pannexins, a family of gap junction proteins expressed in brain

Affiliations

Pannexins, a family of gap junction proteins expressed in brain

Roberto Bruzzone et al. Proc Natl Acad Sci U S A. .

Abstract

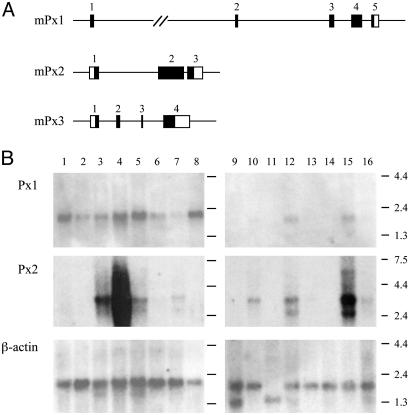
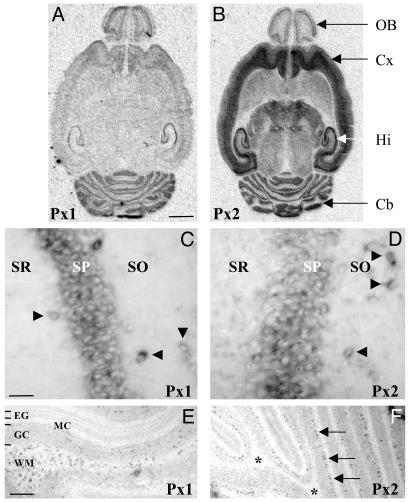
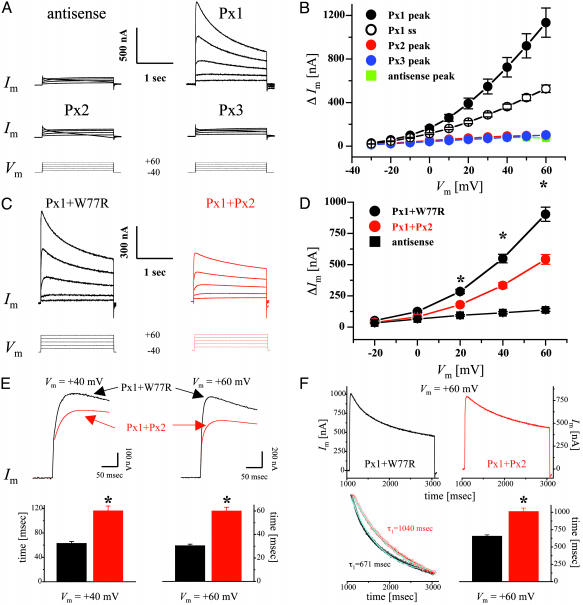
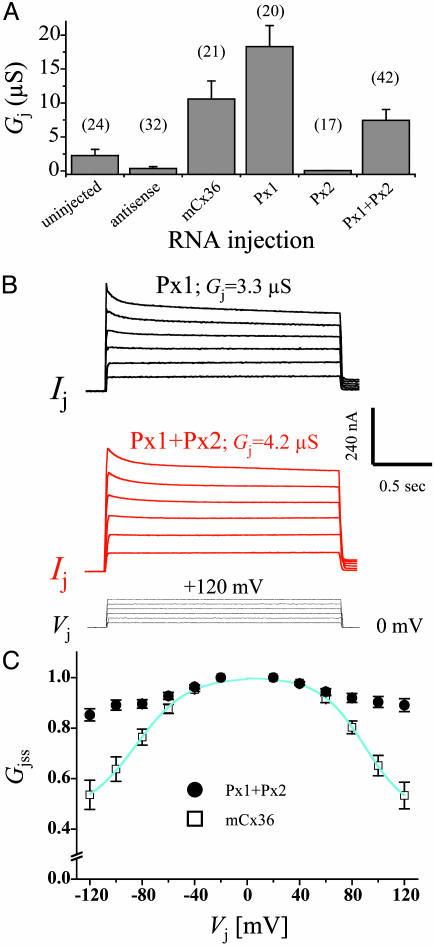
Database search has led to the identification of a family of proteins, the pannexins, which share some structural features with the gap junction forming proteins of invertebrates and vertebrates. The function of these proteins has remained unclear so far. To test the possibility that pannexins underlie electrical communication in the brain, we have investigated their tissue distribution and functional properties. Here, we show that two of these genes, pannexin 1 (Px1) and Px2, are abundantly expressed in the CNS. In many neuronal cell populations, including hippocampus, olfactory bulb, cortex and cerebellum, there is coexpression of both pannexins, whereas in other brain regions, e.g., white matter, only Px1-positive cells were found. On expression in Xenopus oocytes, Px1, but not Px2 forms functional hemichannels. Coinjection of both pannexin RNAs results in hemichannels with functional properties that are different from those formed by Px1 only. In paired oocytes, Px1, alone and in combination with Px2, induces the formation of intercellular channels. The functional characteristics of homomeric Px1 versus heteromeric Px1/Px2 channels and the different expression patterns of Px1 and Px2 in the brain indicate that pannexins form cell type-specific gap junctions with distinct properties that may subserve different functions.


Figures

Fig. 1.
Fig. 1.
Gene organization and mRNA expression in rodents. (A) The loci of the three pannexins in the mouse genome, indicating their exon (numbered boxed regions) and intron structure, are displayed. Within each exon, nucleotides contributing to the presumed protein sequence for each pannexin are shaded. (B) Northern blot analysis was performed on rat poly(A)+ RNA (lanes 1-16: adrenal gland, bladder, eye, spinal cord, thyroid, stomach, prostate, large intestine, testis, kidney, skeletal muscle, liver, lung, spleen, brain, and heart, respectively). The two filters were hybridized with probes for each of the three pannexins and exposed for 16 h at -70°C. The Px1 probe hybridized to a 2.2-kb mRNA that was detectable in several organs, including spinal cord and brain. The 3.5-kb Px2 was most abundant in spinal cord and brain and was also present in other organs. A less prominent 2.5-kb transcript was observed in some organs. Px3 mRNA was observed only in skin (data not shown).
Fig. 2.
Fig. 2.
Expression of Px1 and Px2 mRNA in the brain. (A and B) The distribution of transcripts encoding Px1 and Px2 was determined by radioactive in situ hybridization in horizontal brain sections obtained from rats at P15. X-ray autoradiograms illustrate a partially overlapping expression profile and indicate that they are abundant in the olfactory bulb (OB), cortex (Cx), hippocampus (Hi), and cerebellum (Cb). No signal was detected in parallel competition experiments with an excess of unlabeled probe (data not shown). (Scale bar, 2.5 mm.) (C-F) Nonradioactive in situ hybridization demonstrating that high expression of Px1 (C) and Px2 (D) was detected in the stratum pyramidalis (SP) of the hippocampus and in individual neurons (arrowheads) in the stratum oriens (SO) and stratum radiatum (SR). By contrast, in the cerebellum, there was a strong labeling of Px1-expressing cells (E) in the white matter (WM) where Px2 expression was absent (F, *). Note, however, that the Px2 riboprobe strongly labeled cells in the Purkinje cell layer (F, arrows). No staining was obtained with sense probes (data not shown). EG, external granule cell layer; MC, molecular cell layer; GC, granule cell layer. [Scale bars, 50 μm (C and D) and 250 μm (E and F).]
Fig. 3.
Fig. 3.
Functional expression of pannexins in single Xenopus oocytes. (A) Whole-cell membrane currents (Im) were measured from single oocytes coinjected with pannexin RNAs and an oligonucleotide antisense to Xenopus Cx38 (see Materials and Methods). Cells were initially clamped at a membrane potential (Vm) of -40 mV, and depolarizing steps lasting 2 sec were applied in 10-mV increments up to +60 mV (bottom traces). For clarity, representative traces are shown only in 20-mV increments. (B) Current-voltage relationships were determined for oocytes injected with either antisense oligonucleotides (blue) or Px1 (black), Px2 (red), and Px3 (green) RNAs plus antisense. Peak current values above holding currents (ΔIm) were calculated and plotted as a function of Vm. Mean values from Px1-injected cells were significantly different (P < 0.01) from those of control oocytes starting at a Vm of -10 mV. For Px1 steady-state currents (open circles), values recorded for 20 msec at the end of the pulse were averaged and plotted as above. Results are shown as mean ± SEM from at least eight independent experiments. Antisense, n = 45; Px1, n = 80; Px2, n = 46; Px3, n = 41. (C-F) Functional interaction of Px1 and Px2 proteins. Antisense-treated oocytes were coinjected with Px1 RNA together with equal amounts of RNAs encoding either Px2 (red traces) or the W77R mutation of human Cx26 (black traces), which is devoid of functional activity (31). (C and D) Coexpression of Px1 and Px2 reduced the amplitude of the outward currents induced by the depolarizing voltage steps (bottom traces). ΔIm recorded from Px1/Px2 (red circles) expressing oocytes was significantly less (*, P < 0.001) than that measured from Px1/W77R cells (black circles). Results are shown as mean ± SEM from four independent experiments. Antisense (n = 39); Px1/W77R (n = 60); Px1/Px2 (n = 67). (E) Px1/Px2 channels exhibit a delayed peak current time. Oocytes were depolarized to +40 mV (top left traces) and +60 mV (top right traces) from a holding potential of -40 mV. Peak currents were reached with a significant delay after the imposition of the voltage step (32 and 68 msec at +60 mV and 62 and 96 msec at +80 mV, for Px1/W77R and Px1/Px2, respectively). The lower panels show the mean ± SEM from three independent experiments for Px1/W77R (n = 45) and Px1/Px2 (n = 50); *, P < 0.001. (F) Px2 slows the kinetics of voltage-dependent closure of Px1 hemichannels. Cells were depolarized to +60 mV from a holding potential of -40 mV (Upper). Px1/Px2 hemichannels (red) gated more slowly than those formed by Px1/W77R (black). The time-dependent decline in Im was well fit by a first-order exponential decay function (Left Lower; cyanide line superposed to the rescaled current traces shown above). (Right Lower) The mean ± SEM from three independent experiments, for Px1/W77R (n = 44) and Px1/Px2 (n = 41); *, P < 0.001.
Fig. 4.
Fig. 4.
Functional expression of pannexims in paired oocytes. Cells were injected as described in Materials and Methods and were manually paired in homotypic configuration (same construct in both oocytes). (A) Both cells of a pair were initially clamped at -40 mV, and alternating pulses of ±10-20 mV were imposed to one cell. The current delivered to the cell clamped at -40 mV during the voltage pulse is equal in magnitude to the junctional current and can be divided by the voltage to yield the value of junctional conductance (Gj). Pairs of uninjected cells from the different batches of oocytes developed a variable level of junctional currents that exhibited the well known voltage-dependent gating of endogenous Cx38 (42), whereas antisense controls showed negligible coupling, indicating that endogenous currents had been suppressed. Oocyte pairs injected with Px1 either alone or in combination with Px2 (Px1+Px2) developed large junctional currents, whereas homotypic Px2-expressing pairs were uncoupled. Gj values recorded from oocytes expressing the neuronal mouse Cx36 (mCx36) are shown for comparison. Results are shown as the mean ± SEM of the indicated number of oocyte pairs from four to five independent experiments. (B) Px1 (black) and Px1/Px2 (red) intercellular channels exhibit a weak sensitivity to transjunctional voltage (Vj). Junctional currents (Ij) were recorded from oocyte pairs in response to depolarizing Vj steps (bottom traces) applied, from a holding potential of -40 mV, in 20-mV increments. (C) The plot shows the relationship of Vj to steady-state junctional conductance (Gjss), which was measured at the end of the Vj step and normalized to the values recorded at ± 20 mV; Px1/Px2 (•) and mCx36 (□). Data describing the Gj/Vj relationship were fit (smooth cyanide lines) to a Boltzmann equation, whose parameters were in agreement with those reported (43, 44). Results are shown as the mean ± SEM of 7-12 pairs (from four independent experiments) whose Gj was 3.2 ± 0.8 μS and 4.8 ± 1.1 μS for mCx36 and Px1/Px2, respectively. Because of the much larger nonjunctional currents that were present in Px1 homotypic pairs, reliable Gjss/Vj plots with the complete polarization paradigm were difficult to obtain.

References

    1. Willecke, K., Eiberger, J., Degen, J., Eckardt, D., Romualdi, A., Guldenagel, M., Deutsch, U. & Sohl, G. (2002) Biol. Chem. 383, 725-737. - PubMed
    1. Bennett, M. V. (2000) Brain Res. Brain Res. Rev. 32, 16-28. - PubMed
    1. Galarreta, M. & Hestrin, S. (2001) Nat. Rev. Neurosci. 2, 425-433. - PubMed
    1. Katsumaru, H., Kosaka, T., Heizmann, C. W. & Hama, K. (1988) Exp. Brain Res. 72, 363-370. - PubMed
    1. Galarreta, M. & Hestrin, S. (1999) Nature 402, 72-75. - PubMed

Publication types

MeSH terms

Associated data