. 2003 Nov;112(9):1318-31.
doi: 10.1172/JCI18141.

Angiotensin II-accelerated atherosclerosis and aneurysm formation is attenuated in osteopontin-deficient mice

Affiliations

Angiotensin II-accelerated atherosclerosis and aneurysm formation is attenuated in osteopontin-deficient mice

Dennis Bruemmer et al. J Clin Invest. 2003 Nov.

Abstract

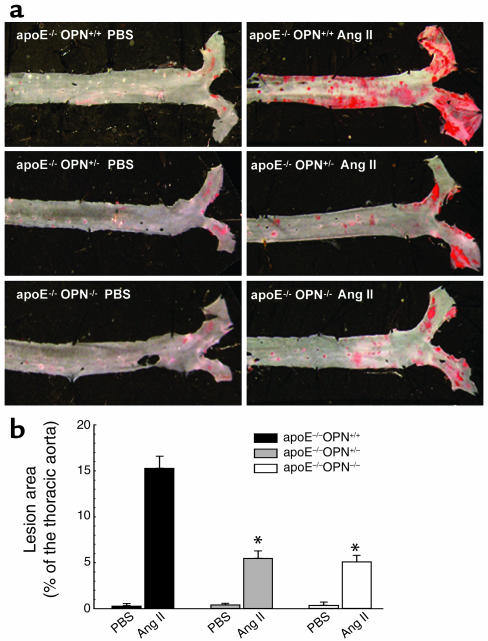
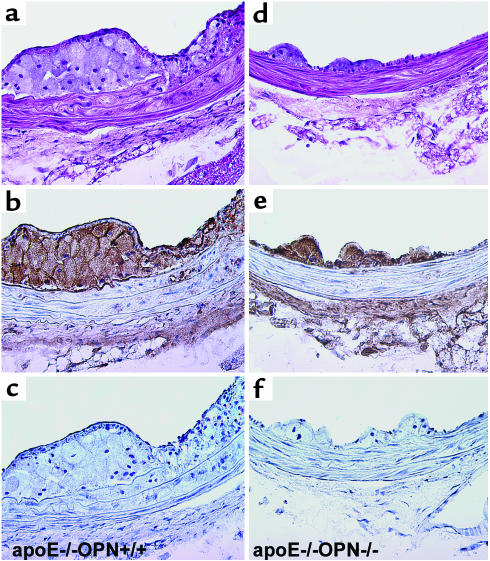
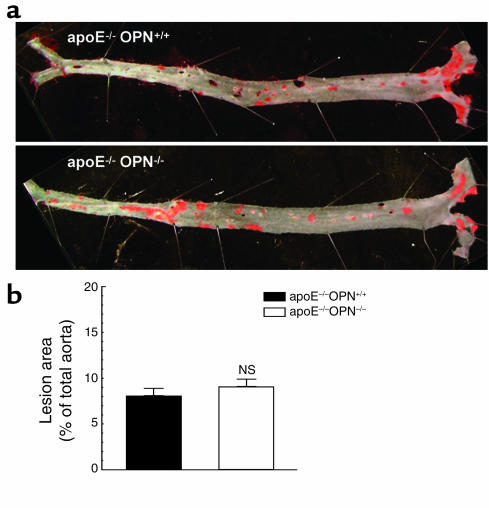
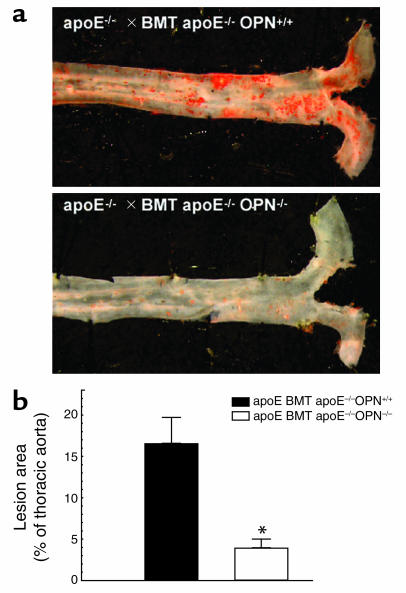
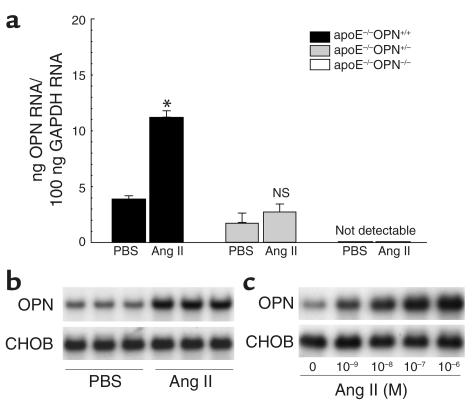
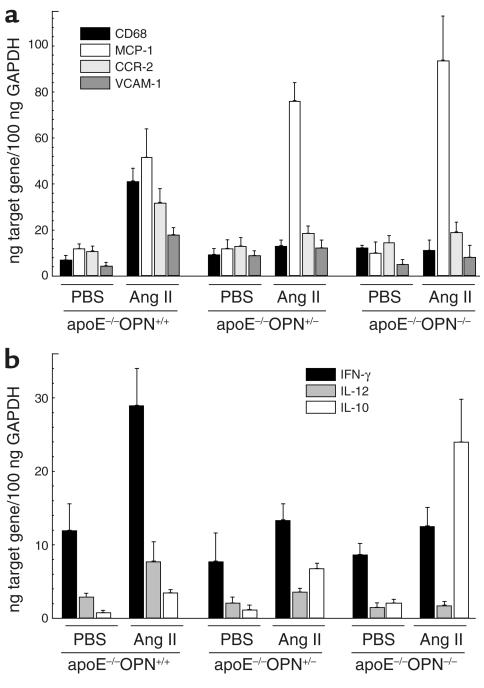
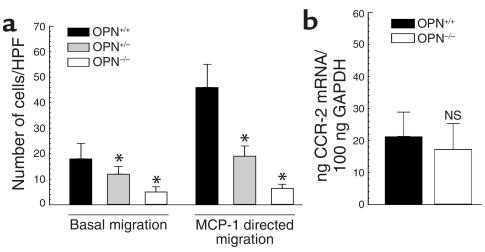
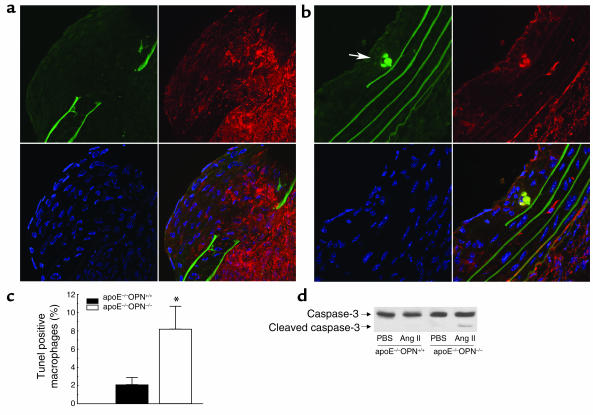
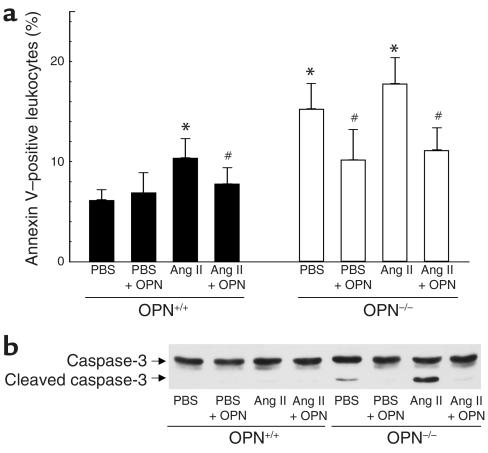
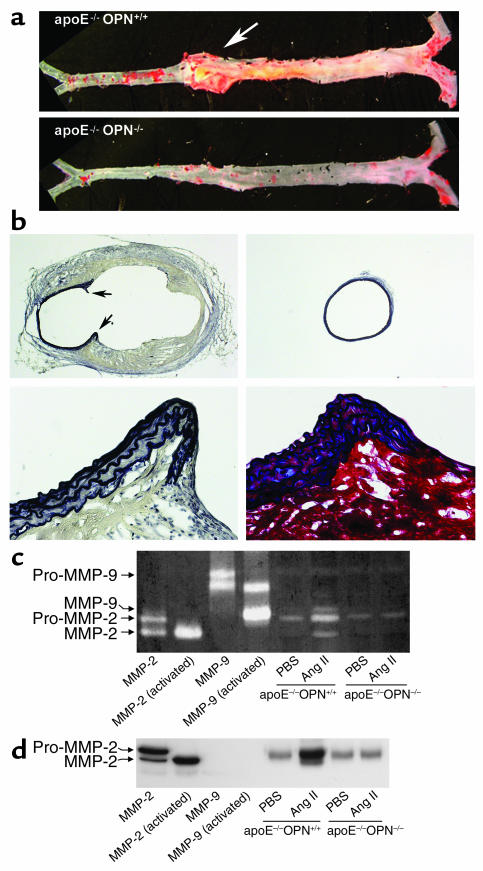
Osteopontin (OPN) is expressed in atherosclerotic lesions, particularly in diabetic patients. To determine the role of OPN in atherogenesis, ApoE-/-OPN+/+, ApoE-/-OPN+/-, and ApoE-/-OPN-/- mice were infused with Ang II, inducing vascular OPN expression and accelerating atherosclerosis. Compared with ApoE-/-OPN+/+ mice, ApoE-/-OPN+/- and ApoE-/-OPN-/- mice developed less Ang II-accelerated atherosclerosis. ApoE-/- mice transplanted with bone marrow derived from ApoE-/-OPN-/- mice had less Ang II-induced atherosclerosis compared with animals receiving ApoE-/-OPN+/+ cells. Aortae from Ang II-infused ApoE-/-OPN-/- mice expressed less CD68, C-C-chemokine receptor 2, and VCAM-1. In response to intraperitoneal thioglycollate, recruitment of leukocytes in OPN-/- mice was impaired, and OPN-/- leukocytes exhibited decreased basal and MCP-1-directed migration. Furthermore, macrophage viability in atherosclerotic lesions from Ang II-infused ApoE-/-OPN-/- mice was decreased. Finally, Ang II-induced abdominal aortic aneurysm formation in ApoE-/-OPN-/- mice was reduced and associated with decreased MMP-2 and MMP-9 activity. These data suggest an important role for leukocyte-derived OPN in mediating Ang II-accelerated atherosclerosis and aneurysm formation.


Figures

Figure 1
Figure 1
Ang II–accelerated atherosclerosis in male ApoE–/–OPN+/+, ApoE–/–OPN+/–, and ApoE–/–OPN–/– OPN mice. Three-month-old mice on a regular chow diet were infused with vehicle or Ang II for 4 weeks. (a) En face analysis of aortae stained with Sudan IV to visualize accumulation of subintimal lipids present in atherosclerotic lesions. (b) Mean atherosclerotic lesion areas of the thoracic aorta from ApoE–/–OPN+/+ wild-type mice (black bars), ApoE–/–OPN+/– (gray bars), and ApoE–/–OPN–/– (white bars) mice determined by computer-assisted image analysis. Data are represented as average percentage of the total surface of the thoracic aorta and expressed as mean ± SEM. *P < 0.05 vs. ApoE–/–OPN+/+ infused with Ang II.
Figure 2
Figure 2
Immunohistochemical characterization of atherosclerotic lesions from ApoE–/–OPN+/+ and ApoE–/–OPN–/– mice 4 weeks after Ang II infusion. Tissues of the thoracic aorta were analyzed by hematoxylin and eosin staining (a and d) or immunohistochemical staining for the presence of macrophages (b and e) and T lymphocytes (c and f) and counterstained with hematoxylin (×400 magnification).
Figure 3
Figure 3
Atherosclerosis in non-Ang II–infused 8-month-old male ApoE–/–OPN+/+ and ApoE–/–OPN–/– mice. (a) En face analysis of aortic atherosclerosis in 8-month-old ApoE–/–OPN+/+ and ApoE–/–OPN–/– mice on a regular chow diet. (b) Mean atherosclerosis development in the total aorta from ApoE–/–OPN+/+ (black bar) and ApoE–/–OPN–/– (white bar) mice analyzed as described in Figure 1.
Figure 4
Figure 4
Atherosclerosis in ApoE–/– mice transplanted with ApoE–/–OPN+/+ or ApoE–/–OPN–/– bone marrow. ApoE–/– mice were transplanted with either ApoE–/–OPN+/+ or ApoE–/–OPN–/– bone marrow and infused with Ang II for 4 weeks. (a) Representative Sudan IV–stained thoracic aorta of each analyzed group. (b) Mean atherosclerotic lesion area of ApoE–/– mice transplanted with ApoE–/–OPN+/+ (black bar) or ApoE–/–OPN–/– (white bar) bone marrow. Data are represented as the average mean lesion area for each group and expressed as mean ± SEM. *P < 0.05 versus ApoE–/– bone marrow-transplanted mice ApoE–/–OPN+/+. BMT, bone marrow transplanted.
Figure 5
Figure 5
OPN mRNA expression in Ang II–infused mice and murine macrophages. (a) Two weeks after infusion with vehicle or Ang II, OPN mRNA of the thoracic aorta from ApoE–/–OPN+/+ (black bars), ApoE–/–OPN+/– (gray bars) and ApoE–/–/OPN–/– (white bars) mice was analyzed by quantitative real-time RT-PCR. Values are normalized for GAPDH expression and expressed as mean ± SEM. *P < 0.05 versus ApoE–/–OPN+/+ mice infused with vehicle. (b) Two weeks after infusion with vehicle (PBS) or Ang II, peritoneal leukocytes from wild-type control mice (n = 3 in each group) were isolated after intraperitoneal injection of thioglycollate. Total RNA was analyzed for OPN expression by Northern blotting. Blots were cohybridized with cDNA encoding the constitutively expressed housekeeping gene CHO gene B (CHOB) to assess equal loading of samples. (c) Peritoneal macrophages were serum deprived for 24 hours and stimulated with increasing doses of Ang II. Twenty-four hours after stimulation, RNA was isolated and analyzed for OPN expression by Northern blotting. The autoradiograms shown are representative of three independently performed experiments.
Figure 6
Figure 6
Expression of CD68, MCP-1, CCR-2, VCAM-1, and the cytokines INF-γ, IL-10, and IL-12 in Ang II–infused mice. ApoE–/–OPN+/+, ApoE–/–OPN+/–, and ApoE–/–OPN–/– mice were infused with vehicle or Ang II for 2 weeks. Tissue mRNA of the thoracic aorta was analyzed for CD68, MCP-1, CCR-2, and VCAM-1 (a) or INF-γ, IL-12, and IL-10 (b) mRNA expression. Data are normalized for GAPDH mRNA expression and are represented as the average mean ± SEM.
Figure 7
Figure 7
Transwell migration and CCR-2 expression of OPN+/+ and OPN–/– leukocytes. (a) Peritoneal leukocytes from OPN+/+ and OPN–/– mice were harvested 3 days after thioglycollate injection and subjected to chemotaxis assays in modified Boyden chambers. Basal migration and MCP-1–directed migration (50 ng/ml) was determined and expressed as cell number counted per HPF (×320). Experiments were repeated three times in duplicate. Data are expressed as mean ± SEM, *P < 0.05 versus OPN+/+ leukocytes. (b) CCR-2 mRNA expression was analyzed by quantitative real-time RT-PCR and normalized to GAPDH mRNA expression (n = 4 in each group). Data are represented as the average mean ± SEM.
Figure 8
Figure 8
Decreased viability of OPN–/– macrophages in atherosclerotic lesions. TUNEL staining of comparable-sized atherosclerotic lesions from Ang II–infused ApoE–/–OPN+/+ (a) and ApoE–/–OPN–/– (b) mice. Cryostat sections were prepared and stained with TUNEL (green) as described in Methods. The elastic lamina of the vessel gives a prominent background staining allowing the detection of breaks as a common feature of Ang II infusion in ApoE–/– mice. Sections were double stained with a rat anti-mouse Mac-3 mAb for the detection of macrophages (red) and DAPI (blue) to stain DNA. The overlay projection on the lower right of each picture allows the detection of colocalizing TUNEL+ macrophages (yellow). The arrow indicates typical examples of TUNEL+ macrophages. (c) The percentage of positively stained macrophages was determined by counting the number of double-stained macrophages and total macrophages of five HPFs per cross section (n = 4) from each mouse (*P < 0.05). (d) Representative Western immunoblot for aortic caspase-3 expression from ApoE–/–OPN+/+ and ApoE–/–OPN–/– mice using an Ab detecting endogenous levels of full-length caspase-3 (35 kDa) and the large fragment of caspase-3 resulting from cleavage (17 kDa).
Figure 9
Figure 9
Decreased viability of peritoneal leukocytes from OPN–/– mice. Peritoneal OPN+/+ and OPN–/– leukocytes were isolated 4 weeks after infusion with vehicle or Ang II by injection of thioglycollate alone or by coinjection with 10 μg recombinant mouse OPN. (a) Leukocytes from OPN+/+ (black bars) and OPN–/– (white bars) were stained with annexin V-FITC and analyzed by flow cytometry. Values are expressed as mean percentage of 10,000 counted cells ± SEM. *P < 0.05 versus OPN+/+ leukocytes from vehicle-infused mice, #P < 0.05 versus leukocytes from mice elicited by thioglycollate injection alone. (b) Protein extracts were analyzed by Western blot analysis for caspase-3 cleavage using an Ab detecting endogenous levels of full-length caspase-3 (35 kDa) and the large fragment of caspase-3 resulting from cleavage (17 kDa). The autoradiogram shown is representative of three independently performed experiments.
Figure 10
Figure 10
Decreased Ang II–induced abdominal aortic aneurysm formation and MMP-2 and MMP-9 activity in ApoE–/–OPN–/– mice. (a) Representative aorta from ApoE–/–OPN+/+ and ApoE–/–OPN–/– mice infused with Ang II for 4 weeks. The arrow indicates a typical abdominal aortic aneurysm in ApoE–/–OPN+/+ mice. (b) Characteristics of aneurysmal tissue from the abdominal aorta of ApoE–/–OPN+/+ and ApoE–/–OPN–/– mice infused with Ang II. EVG staining of the elastic lamina (black) of ApoE–/–OPN+/+ (upper left) and ApoE–/–OPN–/– (upper right) mice (both ×20 magnification). The arrows indicate the disruption of the media and breaks of the elastic lamina. EVG (lower left) and trichrome (lower right) staining at higher power demonstrate the abdominal aortic wall of ApoE–/–OPN+/+ mice containing smooth muscle cells (red) between elastic fibers (black) at the edge of the disrupted media. (c) Representative zymography analysis of MMP activities in the aorta from Ang II–infused ApoE–/–OPN+/+ and ApoE–/–OPN–/– mice. Recombinant mouse MMP-2 and MMP-9 was activated by incubation with p-aminophenylmercuric acetate and used for calibration. (d) Representative Western blot analysis of aortic MMP-2 expression in ApoE–/–OPN+/+ and ApoE–/–OPN–/– mice. Recombinant MMP-2 and MMP-9 was used as positive control and for determination of specificity.

References

    1. O’Regan A, Berman JS. Osteopontin: a key cytokine in cell-mediated and granulomatous inflammation. Int. J. Exp. Pathol. 2000;81:373–390. - PMC - PubMed
    1. Denhardt DT, Giachelli CM, Rittling SR. Role of osteopontin in cellular signaling and toxicant injury. Annu. Rev. Pharmacol. Toxicol. 2001;41:723–749. - PubMed
    1. Franzen A, Heinegard D. Isolation and characterization of two sialoproteins present only in bone calcified matrix. Biochem. J. 1985;232:715–724. - PMC - PubMed
    1. Oldberg A, Franzen A, Heinegard D. Cloning and sequence analysis of rat bone sialoprotein (osteopontin) cDNA reveals an Arg-Gly-Asp cell-binding sequence. Proc. Natl. Acad. Sci. U. S. A. 1986;83:8819–8823. - PMC - PubMed
    1. Katayama Y, et al. Casein kinase 2 phosphorylation of recombinant rat osteopontin enhances adhesion of osteoclasts but not osteoblasts. J. Cell Physiol. 1998;176:179–187. - PubMed

Publication types

MeSH terms