. 2003 Nov;112(9):1383-94.
doi: 10.1172/JCI18212.

NADPH oxidase signal transduces angiotensin II in hepatic stellate cells and is critical in hepatic fibrosis

Affiliations

NADPH oxidase signal transduces angiotensin II in hepatic stellate cells and is critical in hepatic fibrosis

Ramon Bataller et al. J Clin Invest. 2003 Nov.

Abstract

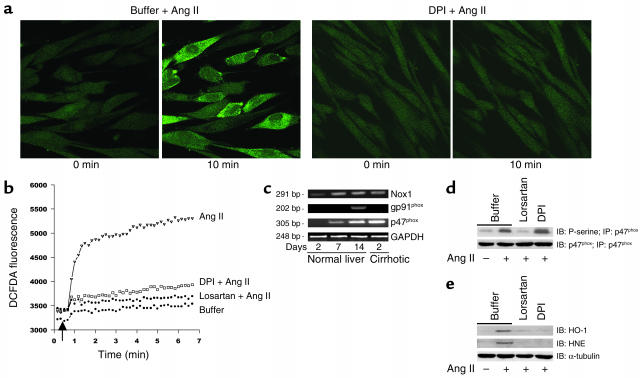
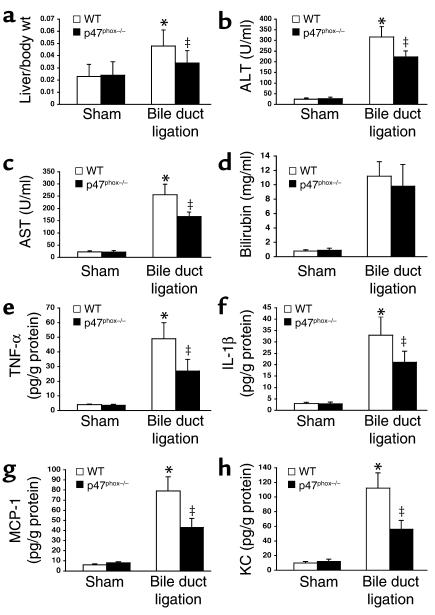
Angiotensin II (Ang II) is a pro-oxidant and fibrogenic cytokine. We investigated the role of NADPH oxidase in Ang II-induced effects in hepatic stellate cells (HSCs), a fibrogenic cell type. Human HSCs express mRNAs of key components of nonphagocytic NADPH oxidase. Ang II phosphorylated p47phox, a regulatory subunit of NADPH oxidase, and induced reactive oxygen species formation via NADPH oxidase activity. Ang II phosphorylated AKT and MAPKs and increased AP-1 DNA binding in a redox-sensitive manner. Ang II stimulated DNA synthesis, cell migration, procollagen alpha1(I) mRNA expression, and secretion of TGF-beta1 and inflammatory cytokines. These effects were attenuated by N-acetylcysteine and diphenylene iodonium, an NADPH oxidase inhibitor. Moreover, Ang II induced upregulation of genes potentially involved in hepatic wound-healing response in a redox-sensitive manner, as assessed by microarray analysis. HSCs isolated from p47phox-/- mice displayed a blunted response to Ang II compared with WT cells. We also assessed the role of NADPH oxidase in experimental liver fibrosis. After bile duct ligation, p47phox-/- mice showed attenuated liver injury and fibrosis compared with WT counterparts. Moreover, expression of smooth muscle alpha-actin and expression of TGF-beta1 were reduced in p47phox-/- mice. Thus, NADPH oxidase mediates the actions of Ang II on HSCs and plays a critical role in liver fibrogenesis.


Figures

Figure 1
Figure 1
Ang II increases ROS formation and lipid peroxidation in human HSCs via NADPH activity. (a) HSCs were loaded with DCFDA (10 mM) and studied with laser confocal microscopy. Ang II (10–8 M) markedly increased cell fluorescence. This effect was prevented by DPI (10–6 M). (b) Quantification of fluorescent changes in DCFDA-loaded cells using a fluorometer at excitation and emission wavelengths of 488 nm and 520 nm, respectively. Ang II increased cell fluorescence that was blocked by DPI and losartan (10–7 M). Data are representative of three independent experiments. (c) Expression of mRNA encoding p47phox, gp91phox, and Nox1 in human HSCs, as assessed by RT-PCR. Quiescent HSCs (2 days in culture after isolation from a normal human liver), human HSCs activated in culture (cells isolated from normal livers and cultured for 14 days), and HSCs activated in vivo (2 days in culture after isolation from a human cirrhotic liver) were studied. GAPDH was amplified to demonstrate equal loading. (d) Ang II phosphorylates p47phox in human HSCs. Cells were treated with Ang II for 5 minutes, and cell extracts were immunoprecipitated with anti-p47phox antibody and blotted with either anti-p47phox antibody or anti-phosphoserine (P-serine) antibody. (e) Ang II induces HNE protein adducts and upregulates heme oxygenase-1 (HO-1) protein expression in HSCs. HSCs were stimulated for 12 hours with Ang II, and cell extracts were blotted with anti-HNE and anti–heme oxygenase-1 antibodies. Cells were preincubated with buffer, DPI, or losartan before addition of Ang II. α-Tubulin was used to demonstrate equal loading.
Figure 2
Figure 2
Ang II stimulates intracellular signaling pathways in human HSCs in a redox-sensitive manner. (a) Ang II stimulates phosphorylation of MAPK proteins and AKT in a redox-sensitive manner. HSCs preincubated with buffer, losartan (10–7 M), the AT2 receptor antagonist PD123319 (10–7 M), NAC (10–4 M), or DPI (10–6 M) were stimulated for 10 minutes with Ang II (10–8 M). Twenty-five micrograms of cell extracts were subjected to Western blotting using anti–phospho–ERK-2, anti–phospho–c-Jun, and anti–phospho–p38 MAPK antibodies. Anti–α-tubulin antibody was used to demonstrate equal protein loading. ERK-2, JNK, AKT, and p38 MAPK activities were assessed by specific kinase assays (see Methods). Cells were stimulated for 10 minutes with Ang II (10–8 M) in the presence or absence of losartan, PD123319, NAC, and DPI. (b) Ang II does not induce phosphorylation of STAT1 and STAT3. Cells were stimulated for 10 minutes with Ang II (10–8 M) or IFN-γ (100 U/ml), and 25 μg of cell extracts were subjected to Western blotting using anti–phospho-STAT1 and -STAT3 antibodies. Anti–α-tubulin antibody was used to demonstrate equal protein loading. (c) Ang II activates AP-1 DNA binding in human HSCs. Stimulation with Ang II (10–8 M) for 2 hours increased AP-1 binding, as assessed by electrophoretic mobility shift assay. This effect was prevented by losartan (10–7 M), NAC (10–5 M), and DPI (10–6 M), but not by PD123319 (10–7 M). Numbers underneath the gel represent fold expression compared with cells treated with buffer.
Figure 3
Figure 3
Ang II induces biological effects in human HSCs in a redox-sensitive manner. (a) Ang II (10–8 M) increases DNA synthesis. This effect was prevented by losartan (10–7 M), the ERK inhibitor PD98059 (5.10–6 M), the PI3K inhibitor LY294002 (2.10–6 M), NAC (10–5 M), and DPI (10–6 M), but not by the AT2 antagonist PD123319 (10–7 M). Results are expressed as mean ± SD of three independent experiments. *P < 0.01 vs. buffer; P < 0.01 vs. buffer + Ang II. (b) Ang II increased the number of HSCs migrating through a modified Boyden chamber. Pretreatment with losartan, LY294002, NAC, and DPI inhibited this effect. Results are the mean ± SD from three independent experiments. *P < 0.01 vs. buffer; P < 0.05 vs. buffer + Ang II. (c) In vitro wound-healing assay. Ang II induced migration of cells into the wound. This effect was inhibited by losartan and DPI. Images are representative of three independent experiments. (d) Ang II induces the secretion of proinflammatory chemokines. Ang II increased secretion of IL-8 (white bars) and MCP-1 (black bars). The base-line levels of MCP-1 and IL-8 were 545 ± 43 pg/ml and 119 ± 23 pg/ml, respectively. Pretreatment with losartan, NAC, and DPI attenuated this effect. Incubation with PD98059, LY294002, the p38 MAPK inhibitor SB203580 (10–6 M), and the JNK inhibitor SP600125 (20.10–6 M) attenuated cytokine secretion. Results are the mean ± SD from six independent experiments. *P < 0.05 vs. buffer; P < 0.05 vs. buffer + Ang II.
Figure 4
Figure 4
Ang II exerts profibrogenic actions in rat HSCs in a redox-sensitive manner. Rat HSCs were cultured for 3 days and then stimulated for 24 hours with Ang II (10–8 M) in the presence or absence of losartan (10–7 M), NAC (10–5 M), and DPI (10–6 M). (a) Steady-state mRNA levels of procollagen α1(I) were assessed by RNase protection assay. Data are expressed as the mean ratio between collagen α1(I) and GAPDH mRNA levels of three independent experiments. *P < 0.01 vs. buffer; P < 0.05 vs. Ang II. (b) Ang II stimulates collagen I secretion by rat HSCs. Cell supernatants were collected, proteins precipitated, and collagen I content detected by Western blotting. Relative expression is shown beneath each lane. The figure is representative of three independent experiments. (c) Ang II increases the secretion of bioactive TGF-β1 in rat HSCs. Cells were cultured for 3 days and challenged with agonists for 20 hours. Cell medium was collected, and total and bioactive TGF-β1 were measured by ELISA. Ang II (10–8 M) increased the secretion of bioactive TGF-β1 by 60%. Pretreatment with losartan, NAC, and DPI attenuated this effect. Results are the mean ± SD from three independent experiments. *P < 0.01 vs. buffer; P < 0.05 vs. Ang II.
Figure 5
Figure 5
Effects of Ang II in WT and p47phox–/– mouse HSCs. HSCs were isolated from C57BL/6 WT and p47phox–/– mice. Cells were studied after 14 days in culture (activated phenotype). (a) ROS production was estimated in DCFDA-loaded mouse HSCs by a fluorometer at 485/535 nm. Ang II (10–8 M) increased intracellular ROS in WT HSCs (open triangles), while the increase in ROS was attenuated in p47phox–/– HSCs (filled circles). Cells exposed to buffer did not show any increase in cell fluorescence (WT, filled triangles; p47phox–/–, open circles). (b and c) Ang II (10–8 M) increases DNA synthesis (b) and cell migration (c) in WT mouse HSCs, as assessed by 3H-thymidine uptake and an in vitro migration assay in a modified Boyden chamber, respectively. These effects were markedly attenuated in p47phox–/– HSCs. *P < 0.05, WT buffer vs. WTAng II. P < 0.05, WT Ang II vs. KO. (d) Effect of Ang II on phosphorylation of ERK and c-Jun, as assessed by Western blot analysis. Ang II (10–8 M) stimulates ERK and c-Jun phosphorylation in WT mouse HSCs, while both effects were markedly blunted in p47phox–/– HSCs. Results are representative of three independent experiments.
Figure 6
Figure 6
p47phox–/– mice show attenuated liver injury after bile duct ligation. Effect of bile duct ligation for 2 weeks on liver/body weight ratio (a), serum alanine aminotransferase (ALT) (b), serum aspartate aminotransferase (AST) (c), bilirubin (d), and hepatic concentration of proinflammatory cytokines (TNF-α, IL-1β, MCP-1, and KC) (eh). *P < 0.05 vs. sham operation; P < 0.05 vs. bile duct ligation in p47phox–/–.
Figure 7
Figure 7
p47phox–/– mice are protected from liver fibrosis after bile duct ligation for 2 weeks. Representative photomicrographs of bile duct–ligated liver sections processed for Masson’s trichrome (a and b) and Sirius red staining (c and d). p47phox+/+ mice developed extensive periportal damage, necrotic areas around biliary tracts, bile duct proliferation, and bridging fibrosis (a and c). All these lesions were markedly attenuated in p47phox–/– mice (b and d). (e) Quantitation of the area stained for Sirius red. *P < 0.05 vs. p47phox–/– mice; P < 0.05 vs. bile duct–ligated WT mice. n = 5. (f) Hydroxyproline content in sham-operated and bile duct–ligated livers. *P < 0.05 vs. sham operation; P < 0.05 vs. bile duct ligation in p47phox–/–; n = 5. Immunodetection of smooth muscle α-actin in bile duct–ligated liver sections from p47phox+/+ (g) and p47phox–/– mice (h) and TGF-β1 in bile duct–ligated liver sections from p47phox+/+ (i) and p47phox–/– mice (j). p47phox–/– mice showed decreased staining for both smooth muscle α-actin and TGF-β1 compared with p47phox+/+ mice. Original magnifications were ×40, ad; and ×100, gj. (k) Quantification of smooth muscle α-actin (α-SMA) content in liver tissues by Western blotting. Relative expression is shown beneath each lane. The figure is representative of three independent experiments.

Comment in

References

    1. Albanis E, Friedman SL. Hepatic fibrosis. Pathogenesis and principles of therapy. Clin. Liver Dis. 2001;5:315–334. - PubMed
    1. Bataller R, Brenner DA. Hepatic stellate cells as a target for the treatment of liver fibrosis. Semin. Liver Dis. 2001;21:437–451. - PubMed
    1. Asbert M, et al. Assessment of the renin-angiotensin system in cirrhotic patients. Comparison between plasma renin activity and direct measurement of immunoreactive renin. J. Hepatol. 1992;15:179–183. - PubMed
    1. Paizis G, et al. Up-regulation of components of the renin-angiotensin system in the bile duct-ligated rat liver. Gastroenterology. 2002;123:1667–1676. - PubMed
    1. Powell EE, et al. Host genetic factors influence disease progression in chronic hepatitis C. Hepatology. 2000;31:828–833. - PubMed

Publication types