. 2003 Nov 10;163(3):503-10.
doi: 10.1083/jcb.200304040. Epub 2003 Nov 3.

Evidence for a two membrane-spanning autonomous mitochondrial DNA replisome

Affiliations

Evidence for a two membrane-spanning autonomous mitochondrial DNA replisome

Shelly Meeusen et al. J Cell Biol. .

Abstract

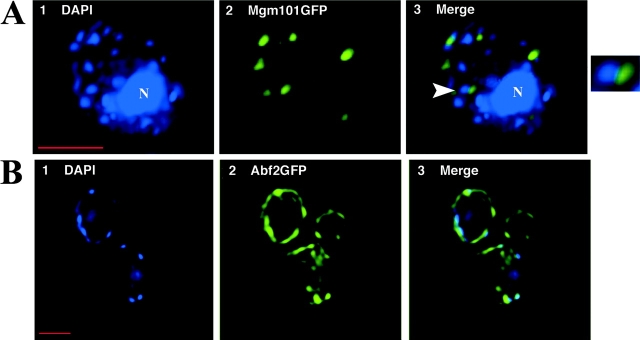
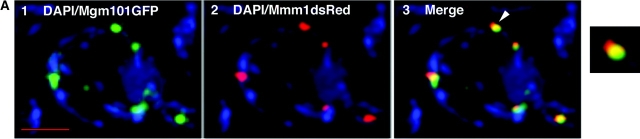
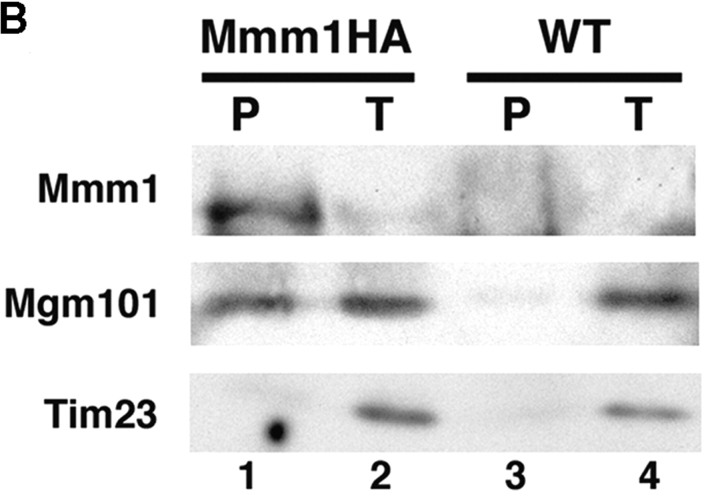
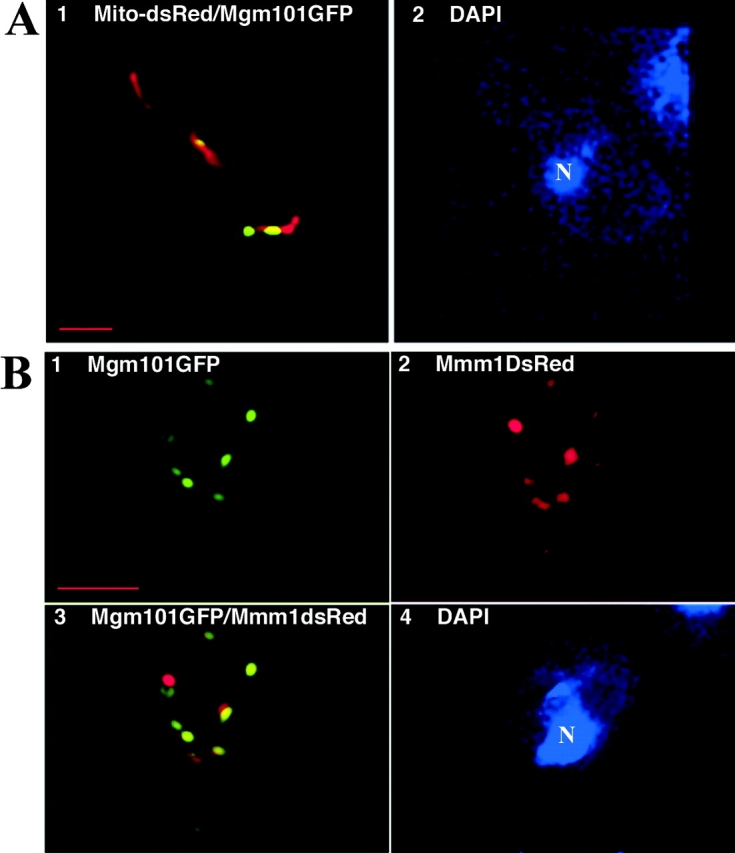
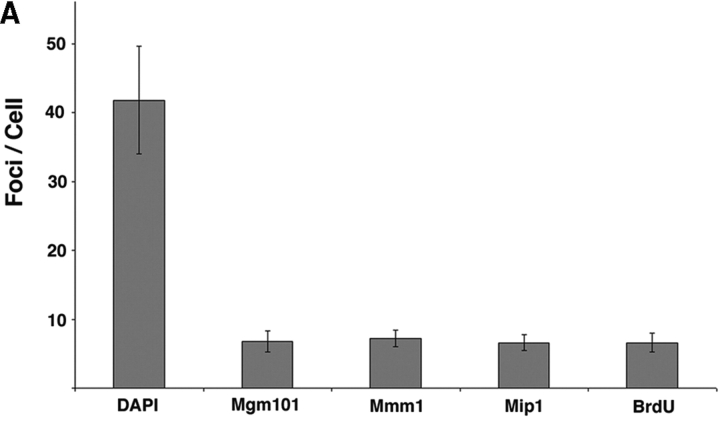
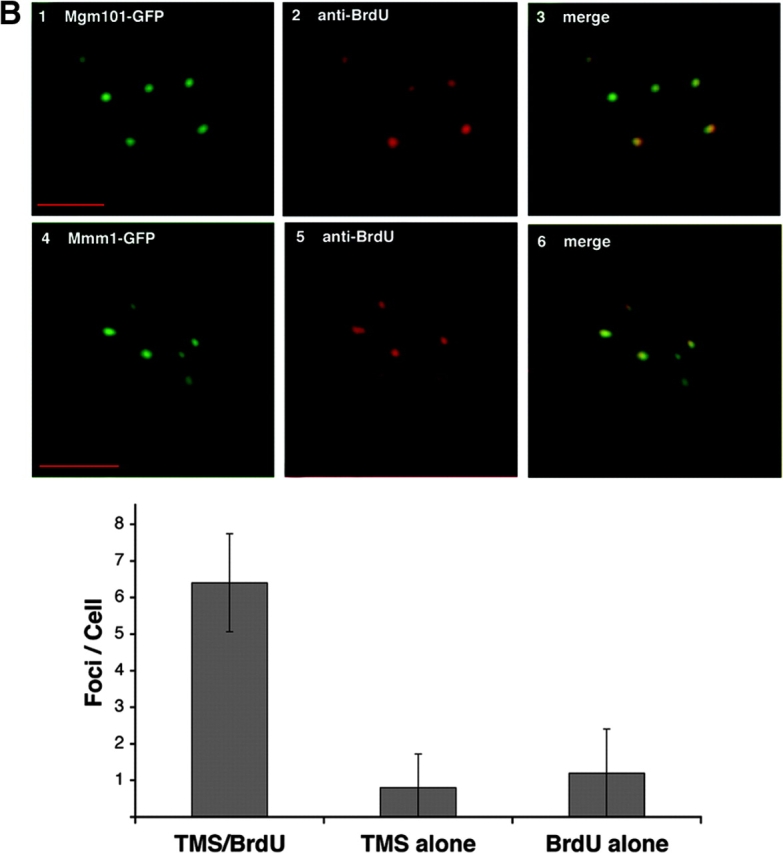
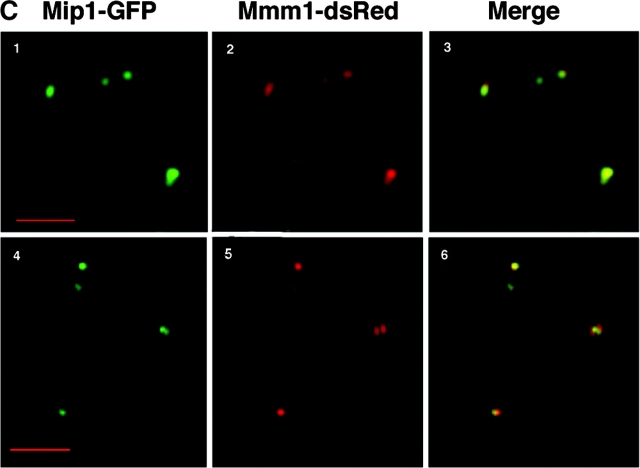
The unit of inheritance for mitochondrial DNA (mtDNA) is a complex nucleoprotein structure termed the nucleoid. The organization of the nucleoid as well as its role in mtDNA replication remain largely unknown. Here, we show in Saccharomyces cerevisiae that at least two populations of nucleoids exist within the same mitochondrion and can be distinguished by their association with a discrete proteinaceous structure that spans the outer and inner mitochondrial membranes. Surprisingly, this two membrane-spanning structure (TMS) persists and self-replicates in the absence of mtDNA. We tested whether TMS functions to direct the replication of mtDNA. By monitoring BrdU incorporation, we observed that actively replicating nucleoids are associated exclusively with TMS. Consistent with TMS's role in mtDNA replication, we found that Mip1, the mtDNA polymerase, is also a stable component of TMS. Taken together, our observations reveal the existence of an autonomous two membrane-spanning mitochondrial replisome as well as provide a mechanism for how mtDNA replication and inheritance may be physically linked.


Figures

Figure 1.
Figure 1.
Mgm101GFP labels a subset of mtDNA nucleoids within cells. Wild-type cells expressing either (A) Mgm101GFP or (B) Abf2GFP were grown overnight in YPG to early log phase and shifted to YPDGal containing 1 μg/ml DAPI for 20 min at 25°C to visualize mtDNA-containing nucleoids. Cells were washed into SD and imaged using a Deltavision deconvolution microscope as described in the Materials and methods. Panel A is a whole cell projection. N indicates nuclear DAPI labeling. Panel B is a 0.2-μm cell section. Arrows in A indicate the region magnified 250% in the corresponding inset. Bars, 2 μm.
Figure 2.
Figure 2.
Matrix Mgm101-labeled foci coalign with outer membrane Mmm1- labeled foci and comprise a TMS. (A) Wild-type cells expressing Mgm101GFP and Mmm1dsRED were cultured in YPG to early log phase, shifted to YPDGal containing 1 μg/ml DAPI for 20 min at 25°C to induce Mgm101GFP expression and visualize mtDNA-containing nucleoids, and washed into SD for imaging. Arrow indicates the region magnified 250% in the inset. Bar, 2 μm. (B) Immunoprecipitations were performed on cross-linked mitochondrial fractions isolated from MMM1:3XHA (designated Mmm1HA, lanes 1 and 2) and wild-type (lanes 3 and 4) cells using anti-HA antibodies as described in the Materials and methods. Western analysis was performed using anti-HA, anti-Mgm101, and anti-Tim23 antibodies. T indicates the total fraction and P indicates the immunoprecipitate. The amount loaded from the T fraction is equivalent to 20% of the P fraction. We conservatively estimate that the recovery Mmm1HA in the P fraction is 50% of the total cellular extract.
Figure 2.
Figure 2.
Matrix Mgm101-labeled foci coalign with outer membrane Mmm1- labeled foci and comprise a TMS. (A) Wild-type cells expressing Mgm101GFP and Mmm1dsRED were cultured in YPG to early log phase, shifted to YPDGal containing 1 μg/ml DAPI for 20 min at 25°C to induce Mgm101GFP expression and visualize mtDNA-containing nucleoids, and washed into SD for imaging. Arrow indicates the region magnified 250% in the inset. Bar, 2 μm. (B) Immunoprecipitations were performed on cross-linked mitochondrial fractions isolated from MMM1:3XHA (designated Mmm1HA, lanes 1 and 2) and wild-type (lanes 3 and 4) cells using anti-HA antibodies as described in the Materials and methods. Western analysis was performed using anti-HA, anti-Mgm101, and anti-Tim23 antibodies. T indicates the total fraction and P indicates the immunoprecipitate. The amount loaded from the T fraction is equivalent to 20% of the P fraction. We conservatively estimate that the recovery Mmm1HA in the P fraction is 50% of the total cellular extract.
Figure 3.
Figure 3.
Matrix and outer membrane components of TMS assemble in the absence of mtDNA. Cells lacking mtDNA expressing Mgm101GFP and (A) mitochondrial-targeted dsRED or (B) Mmm1dsRED were cultured in SD to early log phase, shifted to YPDGal + 1μg/ml DAPI for 60 min at 25°C to induce Mgm101GFP expression and visualize mtDNA-containing nucleoids, and washed into SD for imaging. Panel A represents a 0.2-μm z-section. Bars, 2 μm. Panel B and DAPI panels represent whole cell projections. Bars, 3 μm. N signifies nuclear DAPI labeling.
Figure 4.
Figure 4.
TMS colocalizes with actively replicating mtDNA and the mtDNA polymerase Mip1. (A) The numbers of mitochondrial-associated foci per cell as labeled by DAPI (cells = 9; total foci = 384), Mgm101GFP (cells = 48; total foci = 333), Mmm1dsRED (cells = 38; total foci = 280), Mip1GFP (cells = 21; total foci = 141), and BrdU (cells = 86; total foci = 575) were counted, and averages were plotted for comparison. Error bars indicate the calculated standard deviation of foci per cell. (B) Wild-type cells containing an exogenous thymidine kinase gene (AFS98, see Materials and methods) expressing either Mgm101GFP (panels 1-3) or Mmm1GFP (panels 4-6) were grown overnight in YPG, pulse labeled with BrdU, and analyzed by indirect immunofluorescence as described using a secondary rhodamine-conjugated mouse antibody to the primary mouse monoclonal BrdU antibody. Bars: (panel 1–3) 2 μm; (panels 4–6) 4 μm. The graph represents the number of Mgm101GFP- and Mmm1GFP-labeled foci (indicated by TMS on the x axis) that colocalized with BrdU-labeled foci per cell (cells = 10; total foci = 64). The graph also contains TMS foci and BrdU foci that were alone per cell (cells = 10; total foci TMS = 8; total foci BrdU = 12). Error bars indicate the calculated standard deviation of these measurements per cell. (C) Cells expressing Mip1GFP (panels 1 and 4) under the control of its endogenous promoter in the chromosome and Mmm1dsRed (panels 2 and 5) were cultured overnight in YPG to early log phase before imaging. Two representative cells are shown. Bars, 2 mm.
Figure 4.
Figure 4.
TMS colocalizes with actively replicating mtDNA and the mtDNA polymerase Mip1. (A) The numbers of mitochondrial-associated foci per cell as labeled by DAPI (cells = 9; total foci = 384), Mgm101GFP (cells = 48; total foci = 333), Mmm1dsRED (cells = 38; total foci = 280), Mip1GFP (cells = 21; total foci = 141), and BrdU (cells = 86; total foci = 575) were counted, and averages were plotted for comparison. Error bars indicate the calculated standard deviation of foci per cell. (B) Wild-type cells containing an exogenous thymidine kinase gene (AFS98, see Materials and methods) expressing either Mgm101GFP (panels 1-3) or Mmm1GFP (panels 4-6) were grown overnight in YPG, pulse labeled with BrdU, and analyzed by indirect immunofluorescence as described using a secondary rhodamine-conjugated mouse antibody to the primary mouse monoclonal BrdU antibody. Bars: (panel 1–3) 2 μm; (panels 4–6) 4 μm. The graph represents the number of Mgm101GFP- and Mmm1GFP-labeled foci (indicated by TMS on the x axis) that colocalized with BrdU-labeled foci per cell (cells = 10; total foci = 64). The graph also contains TMS foci and BrdU foci that were alone per cell (cells = 10; total foci TMS = 8; total foci BrdU = 12). Error bars indicate the calculated standard deviation of these measurements per cell. (C) Cells expressing Mip1GFP (panels 1 and 4) under the control of its endogenous promoter in the chromosome and Mmm1dsRed (panels 2 and 5) were cultured overnight in YPG to early log phase before imaging. Two representative cells are shown. Bars, 2 mm.

Similar articles

Cited by

References

    1. Azpiroz, R., and R.A. Butow. 1993. Patterns of mitochondrial sorting in yeast zygotes. Mol. Biol. Cell. 4:21–36. - PMC - PubMed
    1. Bahler, J., J.Q. Wu, M.S. Longtine, N.G. Shah, A. McKenzie, III, A.B. Steever, A. Wach, P. Philippsen, and J.R. Pringle. 1998. Heterologous modules for efficient and versatile PCR-based gene targeting in Schizosaccharomyces pombe. Yeast. 14:943–951. - PubMed
    1. Bevis, B.J., and B.S. Glick. 2002. Rapidly maturing variants of the Discosoma red fluorescent protein (DsRed). Nat. Biotechnol. 20:83–87. (published erratum appears in Nat. Biotechnol. 2002. 20:1159) - PubMed
    1. Birky, C.W., Jr. 1978. Transmission genetics of mitochondria and choroplasts. Annu. Rev. Genet. 12:471–512. - PubMed
    1. Boldogh, I., N. Vojtov, S. Karmon, and L.A. Pon. 1998. Interaction between mitochondria and the actin cytoskeleton in budding yeast requires two integral mitochondrial outer membrane proteins, Mmm1p and Mdm10p. J. Cell Biol. 141:1371–1381. - PMC - PubMed

Publication types

MeSH terms