. 2003 Nov;20(3):168-83.
doi: 10.1002/hbm.10136.

Detection and quantification of a wide range of fMRI temporal responses using a physiologically-motivated basis set

Affiliations

Detection and quantification of a wide range of fMRI temporal responses using a physiologically-motivated basis set

Michael P Harms et al. Hum Brain Mapp. 2003 Nov.

Abstract

The temporal dynamics of fMRI responses can span a broad range, indicating a rich underlying physiology, but also posing a significant challenge for detection. For instance, in human auditory cortex, prolonged sound stimuli ( approximately 30 sec) can evoke responses ranging from sustained to highly phasic (i.e., characterized by prominent peaks just after sound onset and offset). In the present study, we developed a method capable of detecting a wide variety of responses, while simultaneously extracting information about individual response components, which may have different neurophysiological underpinnings. Specifically, we implemented the general linear model using a novel set of basis functions chosen to reflect temporal features of cortical fMRI responses. This physiologically-motivated basis set (the "OSORU" basis set) was tested against (1) the commonly employed "sustained-only" basis "set" (i.e., a single smoothed "boxcar" function), and (2) a sinusoidal basis set, which is capable of detecting a broad range of responses, but lacks a direct relationship to individual response components. On data that included many different temporal responses, the OSORU basis set performed far better overall than the sustained-only set, and as well or better than the sinusoidal basis set. The OSORU basis set also proved effective in exploring brain physiology. As an example, we demonstrate that the OSORU basis functions can be used to spatially map the relative amount of transient vs. sustained activity within auditory cortex. The OSORU basis set provides a powerful means for response detection and quantification that should be broadly applicable to any brain system and to both human and non-human species.


Figures

Figure 1
Figure 1
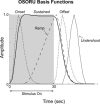
The five physiologically‐motivated functions of the OSORU basis set. The shaded area indicates the period of sound stimulation.
Figure 2
Figure 2
Top three rows: Activation maps obtained using the OSORU, sinusoidal, and sustained‐only basis sets, for two different stimuli that elicit sustained (left) or phasic (right) responses. The OSORU and sinusoidal basis sets perform well, regardless of underlying response waveshape. In contrast, the sustained‐only basis set only performs well when responses are sustained. For each stimulus, the three sets of maps were created using the same underlying data. The data for the two stimuli were obtained in the same imaging session. Stimuli were noise burst trains with repetition rates of 2/sec (left) or 35/sec (right) (burst duration = 25 msec). Each panel is an enlargement of right (R) or left (L) auditory cortex in a near coronal plane. Color activation maps (based on functional images with an in‐plane resolution of 3.1 × 3.1 mm) have been interpolated to the resolution of the grayscale anatomic images (1.6 × 1.6 mm). Bottom: The responses to each stimulus, averaged over the “active” voxels (P < 0.001 in the OSORU maps) in auditory cortex of both hemispheres. Auditory cortex included both Heschl's gyrus and the superior temporal gyrus.
Figure 3
Figure 3
Comparison of OSORU‐based vs. waveform‐based measures of three different response amplitudes: onset, midpoint, and offset. Each + represents a value based on all the “active” voxels in auditory cortex (defined as voxels with P < 0.001 in activation maps generated using the OSORU basis set) for each stimulus of each session. For the OSORU‐based measures, the amplitudes of the basis functions were averaged across the “active” voxels, and then converted to percent change by dividing by the estimated signal baseline (i.e., the value of the constant term in the GLM, averaged across runs and the same active voxels) and multiplying by 100. Values for the waveform‐based measures were taken from waveforms also expressed in terms of percent change. The solid line is the linear regression line relating the two measures. The dashed line represents a one‐to‐one correspondence between the two measures.
Figure 4
Figure 4
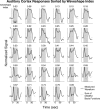
Response waveforms (solid lines) sorted according to their summary waveshape index. Every sixth waveform of the complete, sorted database (177 waveforms) is displayed. The shaded region indicates the 30‐sec stimulus “on” period. Each response is an average across “active” voxels in auditory cortex (P < 0.001 in maps constructed from the OSORU basis set) and across all presentations of a given stimulus in a given session. Responses were converted to percent change, and then normalized to a maximum of one. The number of “active” voxels varied from 3–78 (mean: 39), and the maximum response (prior to normalization) varied from 0.7–3.6% (mean: 1.7%). For an indication of the fit of the OSORU basis set to the responses, the sum of the OSORU basis functions is also plotted (dashed lines). Specifically, this “fitted” response was computed by (1) averaging the estimated amplitudes of a given OSORU basis function across “active” voxels, (2) summing the OSORU basis functions as weighted by these average amplitudes, and (3) normalizing the fitted response to a maximum of one. Only two of the waveforms shown were part of the small subset of responses that were used to guide the design of the OSORU basis functions. Therefore, the majority of the fitted responses provide an independent assessment of the fit of the OSORU basis set to the measured waveforms.
Figure 5
Figure 5
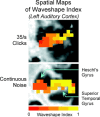
Two cases that showed clear changes in waveshape with position. The cases correspond to two different subjects and stimuli (top: 35/sec clicks; bottom: continuous noise). Each panel shows a color map of waveshape index superimposed on a grayscale anatomical image of the left superior temporal lobe. A waveshape index is indicated for all voxels with P < 0.001 using the OSORU basis set.

References

    1. Andersen AH, Gash DM, Avison MJ (1999): Principal component analysis of the dynamic response measured by fMRI: a generalized linear systems framework. Magn Reson Imag 17: 795–815. - PubMed
    1. Andrade A, Paradis AL, Rouquette S, Poline JB (1999): Ambiguous results in functional neuroimaging data analysis due to covariate correlation. Neuroimage 10: 483–486. - PubMed
    1. Ardekani BA, Kanno I (1998): Statistical methods for detecting activated regions in functional MRI of the brain. Magn Reson Imag 16: 1217–25. - PubMed
    1. Ardekani BA, Kershaw J, Kashikura K, Kanno I (1999): Activation detection in functional MRI using subspace modeling and maximum likelihood estimation. IEEE Trans Med Imag 18: 101–114. - PubMed
    1. Bandettini PA, Kwong KK, Davis TL, Tootell RBH, Wong EC, Fox PT, Belliveau JW, Weisskoff RM, Rosen BR (1997): Characterization of cerebral blood oxygenation and flow changes during prolonged brain activation. Hum Brain Mapp 5: 93–109. - PubMed

Publication types