. 2003 Nov 5;23(31):10164-73.
doi: 10.1523/JNEUROSCI.23-31-10164.2003.

Two modes of vesicle recycling in the rat calyx of Held

Affiliations

Two modes of vesicle recycling in the rat calyx of Held

R P J de Lange et al. J Neurosci. .

Abstract

Vesicle recycling was studied in the rat calyx of Held, a giant brainstem terminal involved in sound localization. Stimulation of brain slices containing the calyx-type synapse with a high extracellular potassium ion concentration in the presence of horseradish peroxidase resulted within several minutes in a reduction of the number of neurotransmitter vesicles and in the appearance of labeled endosome-like structures. After returning to normal solution, the endosome-like structures disappeared over a period of several minutes, whereas simultaneously the number of labeled vesicles increased. A comparison with afferent stimulation suggested that the endosome-like structures normally do not participate in the vesicle cycle. Afferent stimulation at 5 Hz resulted in sustained synaptic transmission, without vesicle depletion but with an estimated endocytotic activity of <0.2 synaptic vesicles per active zone per second. At 20 Hz, the presynaptic action potentials generally failed during prolonged stimulation. In identified synapses, the number of vesicles labeled by photoconversion after stimulation at 5 Hz in the presence of the styryl dye RH414 was much lower than the number of vesicles that were released, as determined by measuring EPSCs. No more than approximately 5% of the vesicles were labeled after 20 min stimulation at 5 Hz, whereas this stimulation protocol was sufficient to largely destain a terminal after previous loading. The results support a scheme for recycling in which two different modes coexist. At physiological demands, a pool of approximately 5% of all vesicles provides sufficient vesicles for release. During intense stimulation, such as occurs in the presence of high extracellular K+, the synapse resorts to bulk endocytosis, a very slow mode of recycling.


Figures

Figure 2.
Figure 2.
Maximal labeling of terminals. Relation between labeling duration using high K+ stimulation and the number of labeled vesicles per micrometer plasma membrane facing the synaptic cleft (left ordinate) or the percentage of vesicles labeled (right ordinate). Slices were fixed (and photoconverted) after a 30 min rest period in Ringer's solution with Advasep after 1 min (n = 4 animals, 14 terminals), 3 min (n = 6 animals, 19 terminals), 15 min (n = 4 animals, 14 terminals), or 30 min (n = 2 animals, 7 terminals) in high K+ stimulation in the presence of FM1-43, RH414, or HRP.
Figure 3.
Figure 3.
Vesicle recycling through endosomal intermediates. A, Labeling endosomal intermediates with HRP. Ultrastructure of terminal after direct fixation after labeling for 3 min in high K+ solution with HRP. A sizeable number of large structures that have taken up HRP can be observed within the terminal (arrows). Most often, the labeled structures were spherical, but sometimes they would be cisternum-like (most right arrow). Also note the presence of multivesicular bodies (arrowheads), which were observed in more than half of all terminals studied. Scale bar, 1 μm. B, Enlargement of right fraction of A, detailing a cisternum-like labeled endosome (right arrow), a spherical labeled endosome (left arrow), and a multivesicular body (arrowhead). Scale bar, 0.5 μm. C, Labeled endosomes disappear while labeled vesicles appear. Left panel, Time course of the disappearance of the large, endosome-like structures. Slices were fixed directly (n = 3 animals, 8 terminals) or rested for 15 min (n = 3 animals, 13 terminals), 30 min (n = 1 animal, 4 terminals), or 60 min (n = 2 animals, 5 terminals) in Ringer's solution after a 3 min labeling in high K+ solution containing HRP. The large endosome-like structures were contoured, and their membrane length was expressed relative to the length of the presynaptic membrane facing the synaptic cleft within the same sections. Middle panel, Increase of the number of labeled vesicles has a similar time course as the decrease in endosome-like structures. Slices were labeled with 3 min high K+ solution stimulation in the presence of HRP, FM1-43, or RH414, and labeled SVs were quantified directly after stimulation (0 min, n = 5 animals, 15 terminals; 10-20 min, n = 5 animals, 26 terminals; 30 min, n = 2 animals, 7 terminals; 60 min, n = 2 animals, 5 terminals). Right panel, The total number of SVs in the terminal relative to the length of the presynaptic membrane facing the synaptic cleft in the same sections is significantly lower (p < 0.05) directly after stimulation (0 min) than after 10-60 min rest (same animals and terminals as in middle panel).
Figure 1.
Figure 1.
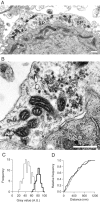
Visualizing vesicle pools in the calyx of Held terminal. A, Example of the ultrastructure of part of a calyx of Held and associated principal cell in the MNTB after photoconversion after a 3 min labeling in high K+ solution in the presence of FM1-43. SP, Spine-like protrusion (found in all terminals studied, often surrounded by clusters of synaptic vesicles). Scale bar, 1 μm. B, Detail of structure in A showing labeled vesicles containing the black photoconversion precipitate and unlabeled clear vesicles. C, Histogram of densities [mean gray value of pixels in a 15 nm radius from the center of the lumen of the vesicles, plotted in arbitrary units (A.U.)] of vesicles that were labeled as positive (thick line) or negative (thin line), showing difference between photoconverted and control vesicles. D, Cumulative histogram of distances of photoconverted (thick line) and control vesicles (thin line) from the plasma membrane facing the synaptic cleft. A-D are from the same experiment.
Figure 5.
Figure 5.
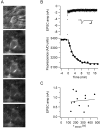
Destaining of terminals labeled with RH414 during prolonged stimulation at 5 Hz. A, Images of terminal. Top image, Infrared differential interference contrast image. Other images, Fluorescence images, taken (from top to bottom) 1 min before and 2, 16, and 30 min after start of afferent stimulation. Scale bar, 10 μm. B, Top panel, Amplitudes of EPSCs during stimulation at 5 Hz. Inset, Sample EPSC. Calibration: 2 msec, 1 nA. Stimulation artifact has been blanked. Bottom panel, Decrease in average fluorescence of the terminal during stimulation. Fluorescence values have been corrected for bleaching. Time 0 denotes the start of stimulation. Solid line is the fit of fluorescence decrease with an exponential function with a time constant of 170 sec. Data in A and B are from the same terminal. C, Relation between the time constant of the fit of the fluorescence decrease during afferent stimulation at 5 Hz with an exponential function (τdestain) and the average amplitude of the EPSCs (n = 12). Solid line is the regression line, showing a lack of a significant correlation (slope 20 pA/min; r = 0.09) between EPSC size and τdestain.
Figure 6.
Figure 6.
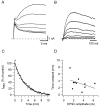
Block of NMDA-type glutamatergic synaptic transmission by open channel blocker MK-801 during low-frequency stimulation. A, Synaptic currents in a principal cell during afferent stimulation at 0.1 Hz in the presence of MK-801 (5 μm). Every 10th stimulus is shown, starting with the first stimulus. Holding potential was +60 mV. Current consisted of a rapid outward current through AMPA-type glutamate receptors, followed by a slower component mediated by NMDA-type glutamate receptors. B, Isolation of the MK-801-sensitive NMDA component by subtraction of the rapid AMPA-type currents. Before subtraction, currents in A were scaled to have the same rapid peak component to reduce the influence of synaptic depression. Note the difference in time scale between A and B. C, Decay of the MK-801-sensitive NMDA current. Same experiment as in A and B. Solid line is the fit of the data with an exponential function with a time constant of 3 min. D, Relation between the time constant of the block of the NMDA currents during afferent stimulation at 0.1 Hz and the average amplitude of the initial NMDA currents measured before application of MK-801 (n = 10 synapses; 7 animals). Solid line is the regression line (r = -0.38; p > 0.05).
Figure 4.
Figure 4.
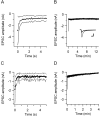
Stability of synaptic transmission at 5 Hz and 20 Hz. A, Average amplitude of EPSCs (n = 11) during 5 Hz stimulation. Solid lines denote mean ± 1 SD. B, Same as A at lower time resolution. Inset shows sample EPSC at 0, 1, 5, 10, and 20 min stimulation of one of the synapses overlaid. Horizontal calibration, 2 msec; vertical, 1 nA. Stimulation artifact has been blanked. C, Average amplitude of EPSCs (n = 5) during 20 Hz stimulation. Solid lines denote mean ± 1 SD. D, Same as C at lower time resolution.
Figure 7.
Figure 7.
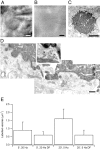
Labeling synaptic vesicles with RH414 in identified terminals with afferent stimulation. A, Differential interference contrast video image of principal cell with patch pipette. B, Fluorescence image showing weak fluorescent staining of the calyx after afferent stimulation. C, EM overview of principal cell showing HRP staining. D, EM detail showing the terminal, with labeled and unlabeled vesicles (inset). In this calyx-type terminal, 1.1 SV/μm plasma membrane facing the synaptic cleft were labeled, or 17 of 259 vesicles (6.2%). A-D are from the same cell. Scale bars: A-C, 5 μm; D, 0.5 μm. E, Labeling for all stimulation conditions. DF, Directly fixed after stimulation. See Results for details.

References

    1. Aravanis AM, Pyle JL, Tsien RW ( 2003) Single synaptic vesicles fusing transiently and successively without loss of identity. Nature 423: 643-647. - PubMed
    1. Betz WJ, Mao F, Bewick GS ( 1992) Activity-dependent fluorescent staining and destaining of living vertebrate motor nerve terminals. J Neurosci 12: 363-375. - PMC - PubMed
    1. Borst JGG, Sakmann B ( 1996) Calcium influx and transmitter release in a fast CNS synapse. Nature 383: 431-434. - PubMed
    1. Forsythe ID ( 1994) Direct patch recording from identified presynaptic terminals mediating glutamatergic EPSCs in the rat CNS, in vitro. J Physiol 479: 381-387. - PMC - PubMed
    1. Forsythe ID, Barnes-Davies M ( 1993) The binaural auditory pathway: excitatory amino acid receptors mediate dual time course excitatory postsynaptic currents in the rat medial nucleus of the trapezoid body. Proc Roy Soc Lond B Biol Sci 251: 151-157. - PubMed

Publication types

MeSH terms

LinkOut - more resources