Comparative Study
. 2003 Nov 15;31(22):6461-72.
doi: 10.1093/nar/gkg866.

Solution structures of stem-loop RNAs that bind to the two N-terminal RNA-binding domains of nucleolin

Affiliations
Comparative Study

Solution structures of stem-loop RNAs that bind to the two N-terminal RNA-binding domains of nucleolin

L David Finger et al. Nucleic Acids Res. .

Abstract

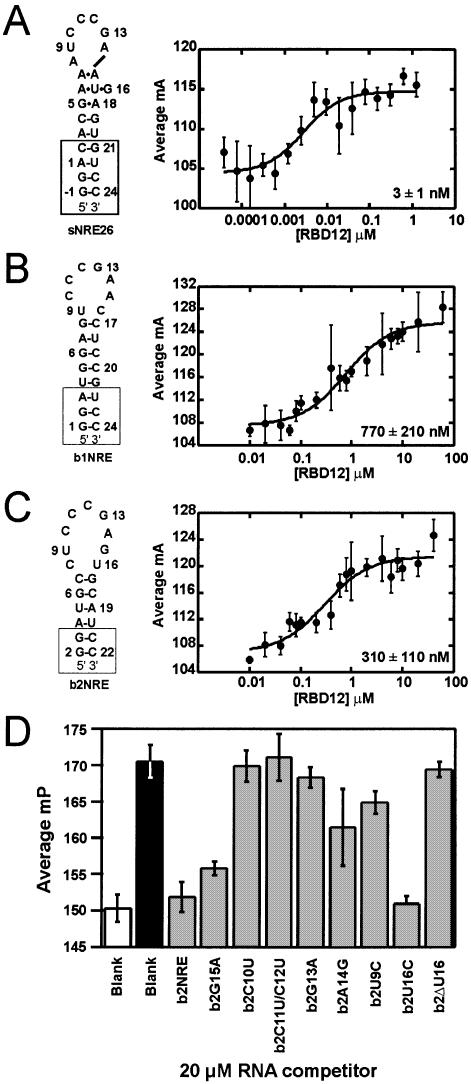
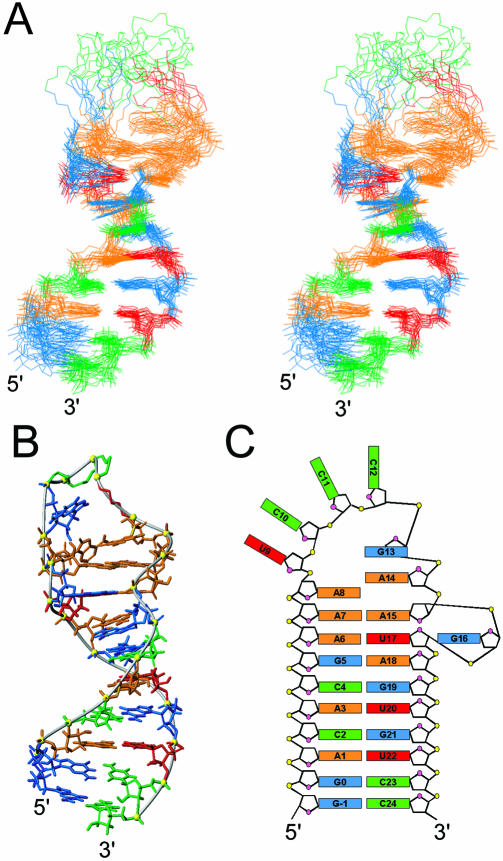
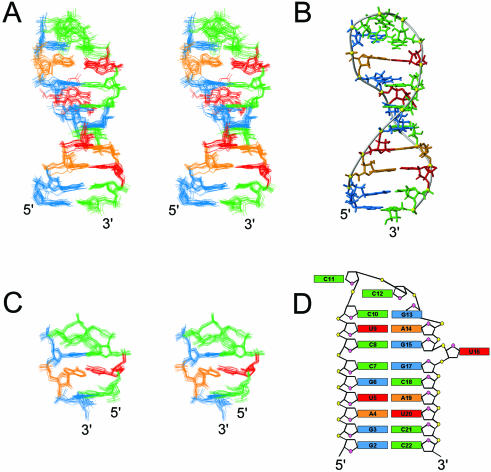
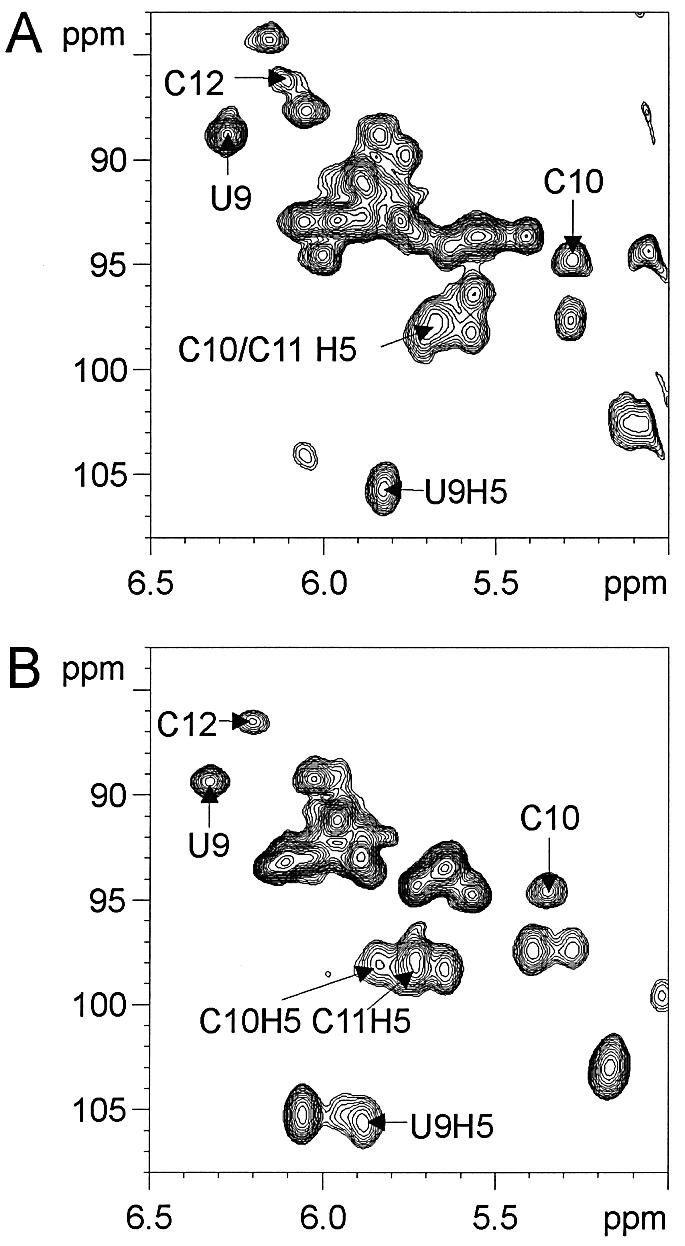
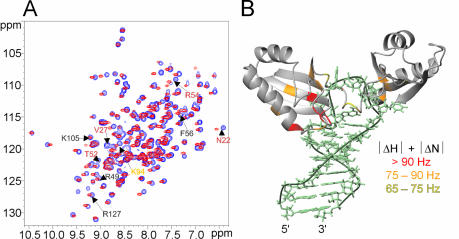
Nucleolin, a multi-domain protein involved in ribosome biogenesis, has been shown to bind the consensus sequence (U/G)CCCG(A/G) in the context of a hairpin loop structure (nucleolin recognition element; NRE). Previous studies have shown that the first two RNA-binding domains in nucleolin (RBD12) are responsible for the interaction with the in vitro selected NRE (sNRE). We have previously reported the structures of nucleolin RBD12, sNRE and nucleolin RBD12-sNRE complex. A comparison of free and bound sNRE shows that the NRE loop becomes structured upon binding. From this observation, we hypothesized that the disordered hairpin loop of sNRE facilitates conformational rearrangements when the protein binds. Here, we show that nucleolin RBD12 is also sufficient for sequence- specific binding of two NRE sequences found in pre-rRNA, b1NRE and b2NRE. Structural investigations of the free NREs using NMR spectroscopy show that the b1NRE loop is conformationally heterogeneous, while the b2NRE loop is structured. The b2NRE forms a hairpin capped by a YNMG-like tetraloop. Comparison of the chemical shifts of sNRE and b2NRE in complex with nucleolin RBD12 suggests that the NRE consensus nucleotides adopt a similar conformation. These results show that a disordered NRE consensus sequence is not a prerequisite for nucleolin RBD12 binding.


Figures

Figure 1
Figure 1
Secondary structure representations (left) and nucleolin RBD12 binding isotherms (right) for (A) sNRE26, (B) b1NRE (nucleotides U3–G21 correspond to mouse 5′ ETS: 515–532) and (C) b2NRE (nucleotides A4–U20 correspond to mouse 5′ ETS: 562–578) (EMBL database accession No. M20154) (11). Nucleotides added for the purpose of transcription and stem stability are shown in boxes. The numbering of sNRE26 and b2NRE has been adjusted to correspond to the original sNRE construct (18). Binding isotherms were generated with 2 nM 5′-fluorescein-labeled NRE and varying nucleolin RBD12 concentrations. Each point is the average of five measurements, and error bars represent the standard deviation of those measurements. Data were fit to equation 2, and all R2 values are >95%. (D) Competition experiments of nucleolin RBD12 binding to b2NRE. Millipolarization (mP) values of free 5′-fluorescein-labeled b2NRE (Flb2) (white), Flb2 in the presence of 10 µM nucleolin RBD12 (black), and Flb2 in the presence of 10 µM nucleolin RBD12 and 20 µM (10 000× probe concentration) specified competitor RNA (gray).
Figure 2
Figure 2
One-dimensional spectra (500 MHz) of the imino proton resonances of sNRE26 at 278 K as a function of pH. Resonance assignments are indicated.
Figure 3
Figure 3
NOESY spectra of the base proton–H1′ region of sNRE26 and b2NRE. (A) The 500 MHz NOESY spectrum of sNRE26 at 298 K and τm = 200 ms. Sequential connectivities from G –1 to A8, C10 to C12 and G13 to C24 are shown in red, black and blue, respectively. The base–H1′ sequential connectivities for G19 are not shown since it resonates upfield at 3.82 p.p.m. There is no base–H1′ sequential connectivity between A15 and G16; however, NOEs from A15–U17 are observed. In addition, NOEs from U17 to A15 indicate that the sugar of A15 is flipped. (B) The 600 MHz NOESY spectrum of b2NRE at 298 K and τm = 300 ms. Base–H1′ sequential connectivities from G2 to C11 and G13 to C22 are indicated by red and blue lines, respectively. A break in the sequential connectivities is observed between A14 and G15, which is due to the fact that the A13H1′ resonance is broadened to baseline at 298 K. In both spectra, the intranucleotide cross-peaks are labeled. In addition, peaks arising from AH2 resonances are indicated with green lines and labeled accordingly.
Figure 4
Figure 4
Structure of sNRE26. (A) Stereoview of the 17 lowest energy structures. The heavy atom superposition is from –1 to 8 and 15 to 24 of sNRE26. Only the heavy atoms are shown, and the bases of the loop (9–14) have been removed to show only the backbone. (B) Lowest energy structure of sNRE26 with G13 and A14 bases in the loop shown. G13 is syn in all structures and partially stacks on A14 in four of the 17 lowest energy structures. (C) Schematic representation of the sNRE26 structure. Nucleotides are colored red (U), green (C), orange (A) and cyan (G).
Figure 5
Figure 5
Structure of b2NRE. (A) Stereoview of the superposition of the 16 lowest energy structures. Only the heavy atoms are shown. (B) Major groove view of the lowest energy structure of b2NRE. (C) Stereoview of the superposition of nucleotides 8–15 highlighting the tetraloop structure. (D) Schematic representation of the b2NRE structure.
Figure 6
Figure 6
Consensus loop NRE nucleotides of sNRE and b2NRE have similar chemical shifts. 1H–13C HSQC of the H1′–C1′ and H5–C5 region of 13C/15N-labeled (A) sNRE26 and (B) b2NRE in a 1:1 complex with nucleolin RBD12 at 310 K. Assignments of some of the well dispersed peaks are shown (12). Samples were between 0.5 and 1 mM in complex.
Figure 7
Figure 7
Comparison of nucleolin RBD12 in complex with sNRE and b2NRE. (A) 1H–15N HSQC spectra of nucleolin RBD12 in a 1:1 complex with sNRE (purple) and b2NRE (red). Some of the amino acids are labeled (12). Gray labels indicate no or very little chemical shift difference (|ΔN|+|ΔH|<65 Hz); yellow labels indicate small chemical shift changes (|ΔN|+|ΔH|<75 ≥65Hz); orange labels indicate moderate chemical shift differences (|ΔN|+|ΔH|<90 ≥75Hz); and red labels indicate large chemical shift differences (|ΔN|+|ΔH|≥90 Hz). (B) Chemical shift differences observed in (A) illustrated on the lowest energy structure of the nucleolin RBD12–sNRE (12). The largest chemical shift differences are clustered where nucleolin RBD12 contacts the S-shaped backbone of sNRE.

Similar articles

Cited by

References

    1. Srivastava M. and Pollard,H.B. (1999) Molecular dissection of nucleolin’s role in growth and cell proliferation: new insights. FASEB J., 13, 1911–1922. - PubMed
    1. Ginisty H., Sicard,H., Roger,B. and Bouvet,P. (1999) Structure and function of nucleolin. J. Cell Sci., 112, 761–772. - PubMed
    1. Roger B., Moisand,A., Amalric,F. and Bouvet,P. (2002) Repression of RNA polymerase I transcription by nucleolin is independent of the RNA sequence that is transcribed. J. Biol. Chem., 277, 10209–10219. - PubMed
    1. Bouvet P., Diaz,J.-J., Kindbeiter,K., Madjar,J.-J. and Amalric,F. (1998) Nucleolin interacts with several ribosomal proteins through its RGG domain. J. Biol. Chem., 273, 19025–19029. - PubMed
    1. Ghisolfi-Nieto L., Joseph,G., Puvion-Dutilleul,F., Amaric,F. and Bouvet,P. (1996) Nucleolin is a sequence specific RNA-binding protein—characterization of targets on pre-ribosomal RNA. J. Mol. Biol., 260, 34–53. - PubMed

Publication types