

Amplified RNA degradation in T7-amplification methods results in biased microarray hybridizations
- PMID: 14606961
- PMCID: PMC280674
- DOI: 10.1186/1471-2164-4-44
Amplified RNA degradation in T7-amplification methods results in biased microarray hybridizations
Abstract
Background: The amplification of RNA with the T7-System is a widely used technique for obtaining increased amounts of RNA starting from limited material. The amplified RNA (aRNA) can subsequently be used for microarray hybridizations, warranting sufficient signal for image analysis. We describe here an amplification-time dependent degradation of aRNA in prolonged standard T7 amplification protocols, that results in lower average size aRNA and decreased yields.
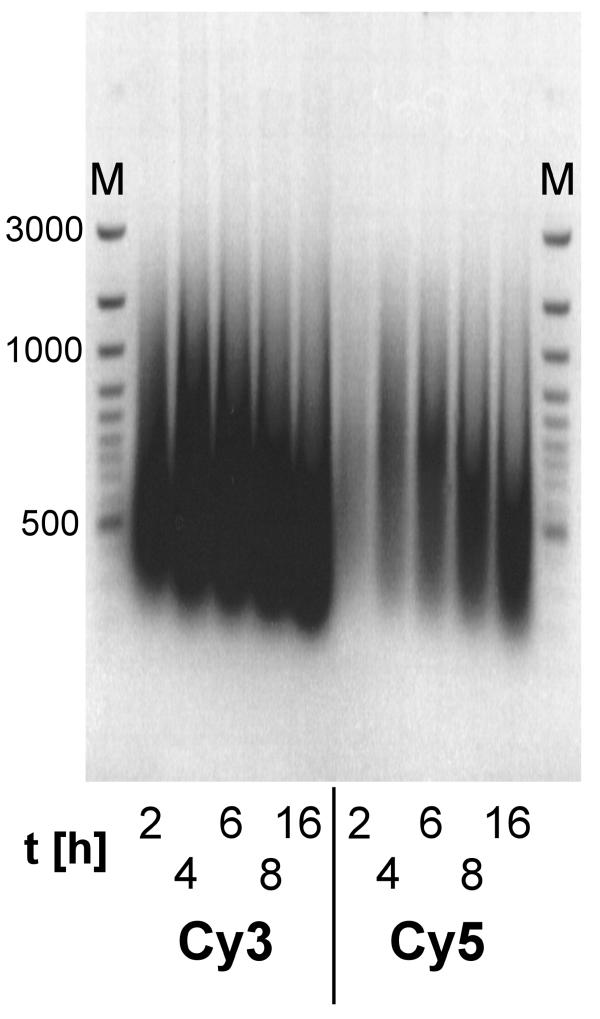
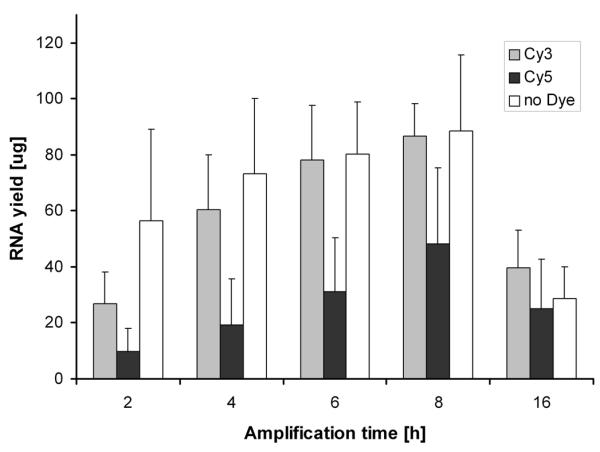
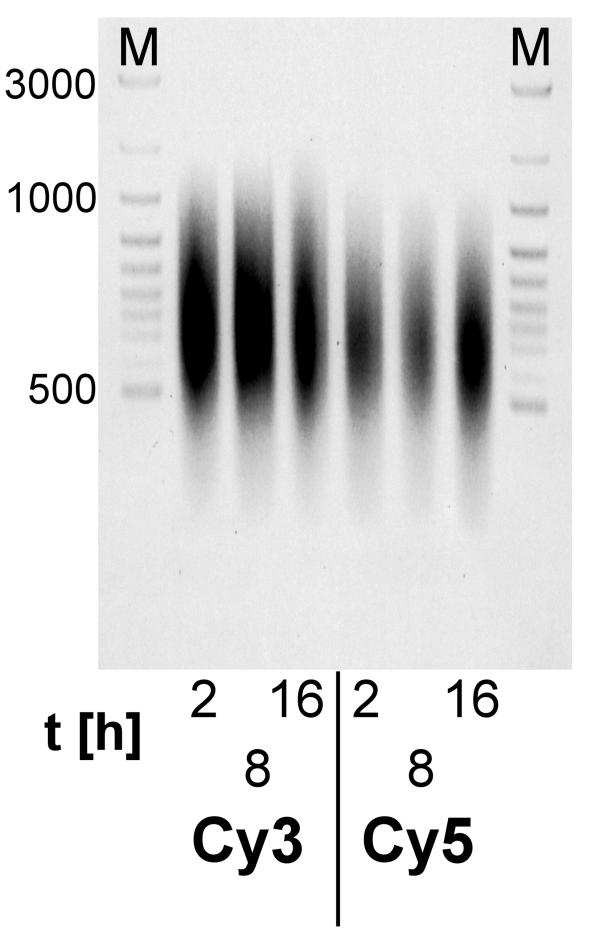
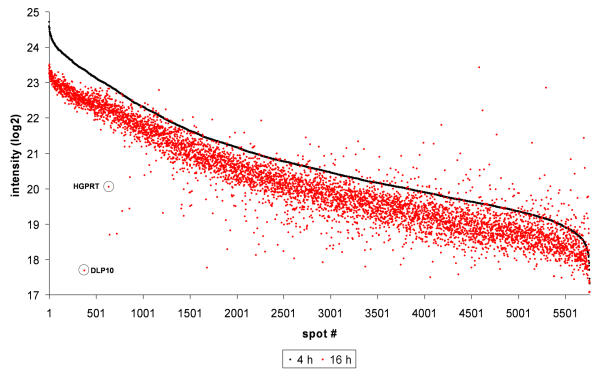
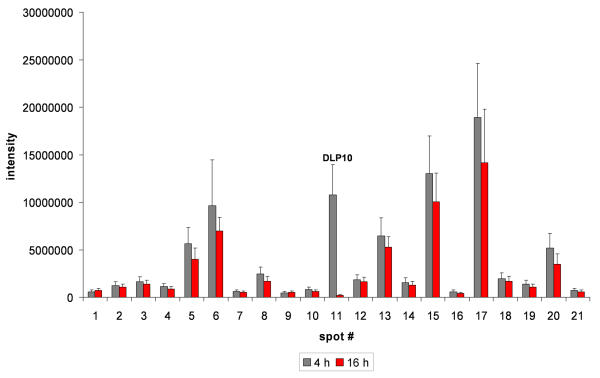
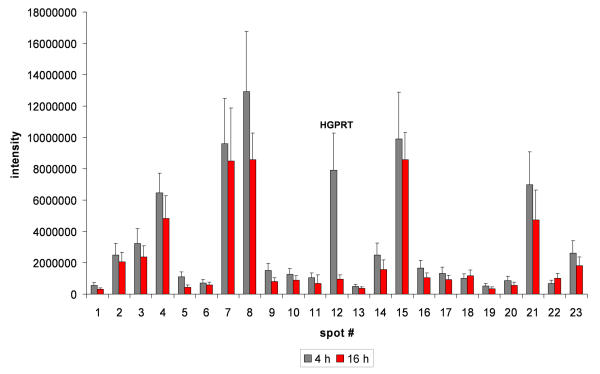
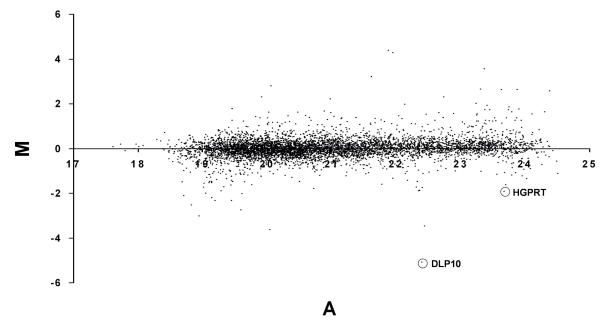
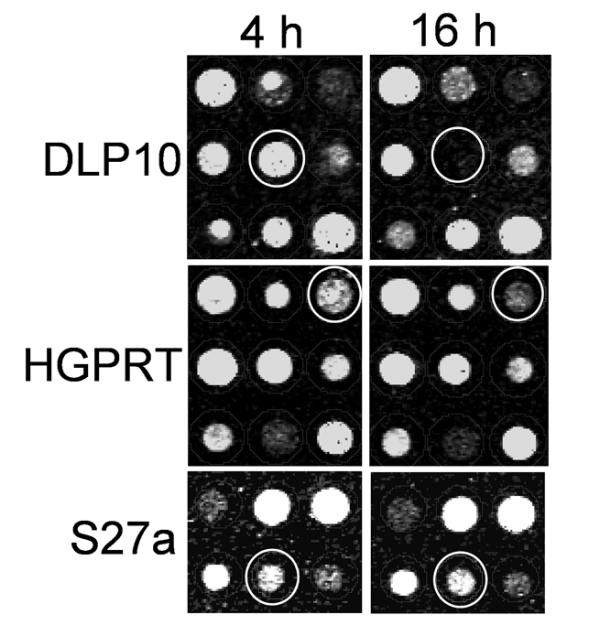
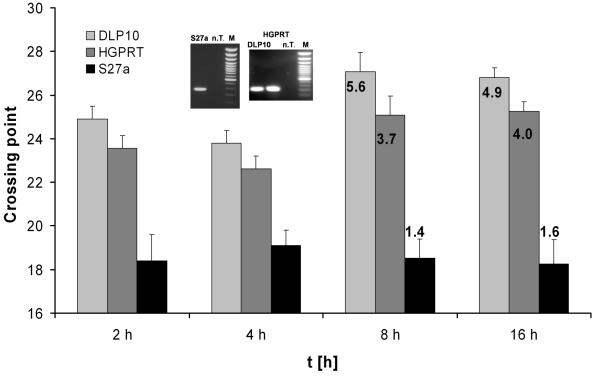
Results: A time-dependent degradation of amplified RNA (aRNA) could be observed when using the classical "Eberwine" T7-Amplification method. When the amplification was conducted for more than 4 hours, the resulting aRNA showed a significantly smaller size distribution on gel electrophoresis and a concomitant reduction of aRNA yield. The degradation of aRNA could be correlated to the presence of the T7 RNA Polymerase in the amplification cocktail. The aRNA degradation resulted in a strong bias in microarray hybridizations with a high coefficient of variation and a significant reduction of signals of certain transcripts, that seem to be susceptible to this RNA degrading activity. The time-dependent degradation of these transcripts was verified by a real-time PCR approach.
Conclusions: It is important to perform amplifications not longer than 4 hours as there is a characteristic 'quality vs. yield' situation for longer amplification times. When conducting microarray hybridizations it is important not to compare results obtained with aRNA from different amplification times.
Figures
Similar articles
-
Real-time monitoring of aRNA production during T7 amplification to prevent the loss of sample representation during microarray hybridization sample preparation.Nucleic Acids Res. 2009 May;37(8):e65. doi: 10.1093/nar/gkp193. Epub 2009 Mar 30. Nucleic Acids Res. 2009. PMID: 19336411 Free PMC article.
-
Systematic analysis of T7 RNA polymerase based in vitro linear RNA amplification for use in microarray experiments.BMC Genomics. 2004 Apr 30;5(1):29. doi: 10.1186/1471-2164-5-29. BMC Genomics. 2004. PMID: 15119961 Free PMC article.
-
An evaluation of linear RNA amplification in cDNA microarray gene expression analysis.Mol Genet Metab. 2006 Jan;87(1):71-9. doi: 10.1016/j.ymgme.2005.08.007. Epub 2005 Oct 7. Mol Genet Metab. 2006. PMID: 16214384
-
RNA profiling in peripheral blood cells by fluorescent differential display PCR.Methods Mol Biol. 2009;496:211-22. doi: 10.1007/978-1-59745-553-4_14. Methods Mol Biol. 2009. PMID: 18839113 Review.
-
Expression profiling using human tissues in combination with RNA amplification and microarray analysis: assessment of Langerhans cell histiocytosis.Amino Acids. 2005 May;28(3):279-90. doi: 10.1007/s00726-005-0177-x. Epub 2005 Mar 30. Amino Acids. 2005. PMID: 15791395 Review.
Cited by
-
Real-time monitoring of aRNA production during T7 amplification to prevent the loss of sample representation during microarray hybridization sample preparation.Nucleic Acids Res. 2009 May;37(8):e65. doi: 10.1093/nar/gkp193. Epub 2009 Mar 30. Nucleic Acids Res. 2009. PMID: 19336411 Free PMC article.
-
Linear nicking endonuclease-mediated strand-displacement DNA amplification.Anal Biochem. 2011 Jul 1;414(1):58-69. doi: 10.1016/j.ab.2011.02.025. Epub 2011 Feb 20. Anal Biochem. 2011. PMID: 21342654 Free PMC article.
-
Comparative evaluation of linear and exponential amplification techniques for expression profiling at the single-cell level.Genome Biol. 2006;7(3):R18. doi: 10.1186/gb-2006-7-3-r18. Epub 2006 Mar 7. Genome Biol. 2006. PMID: 16542485 Free PMC article.
-
Highly parallel genome-wide expression analysis of single mammalian cells.PLoS One. 2012;7(2):e30794. doi: 10.1371/journal.pone.0030794. Epub 2012 Feb 8. PLoS One. 2012. PMID: 22347404 Free PMC article.
-
Estimating RNA-quality using GeneChip microarrays.BMC Genomics. 2012 May 14;13:186. doi: 10.1186/1471-2164-13-186. BMC Genomics. 2012. PMID: 22583818 Free PMC article.
References
-
- Schena M, Shalon D, Davis RW, Brown PO. Quantitative monitoring of gene expression patterns with a complementary DNA microarray. Science. 1995;270:467–470. - PubMed
-
- Lockhart DJ, Dong H, Byrne MC, Follettie MT, Gallo MV, Chee MS, Mittmann M, Wang C, Kobayashi M, Horton H, Brown EL. Expression monitoring by hybridization to high-density oligonucleotide arrays. Nat Biotechnol. 1996;14:1675–1680. - PubMed
Publication types
MeSH terms
Substances
LinkOut - more resources
Full Text Sources
Other Literature Sources
