. 2003 Nov 15;171(10):5188-97.
doi: 10.4049/jimmunol.171.10.5188.

T cell activation-induced mitochondrial hyperpolarization is mediated by Ca2+- and redox-dependent production of nitric oxide

Affiliations

T cell activation-induced mitochondrial hyperpolarization is mediated by Ca2+- and redox-dependent production of nitric oxide

Gyorgy Nagy et al. J Immunol. .

Abstract

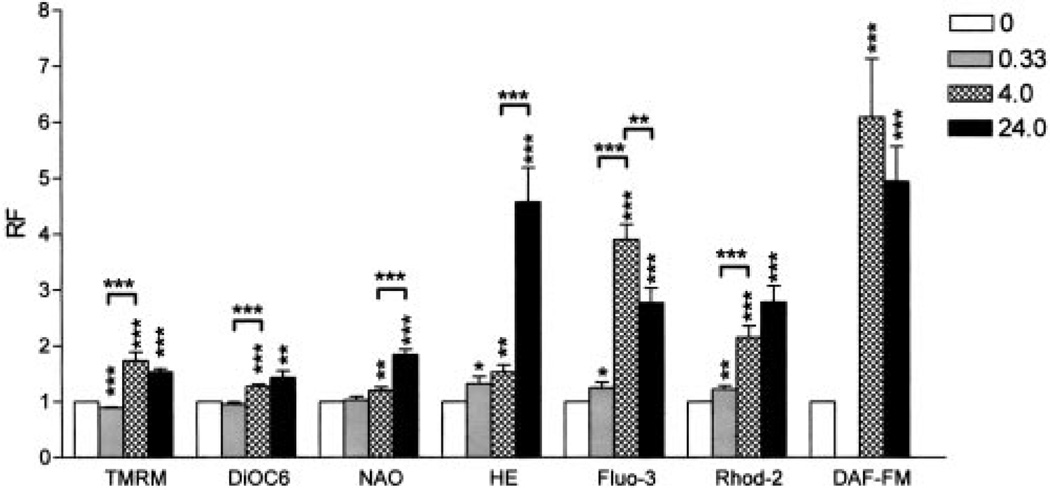
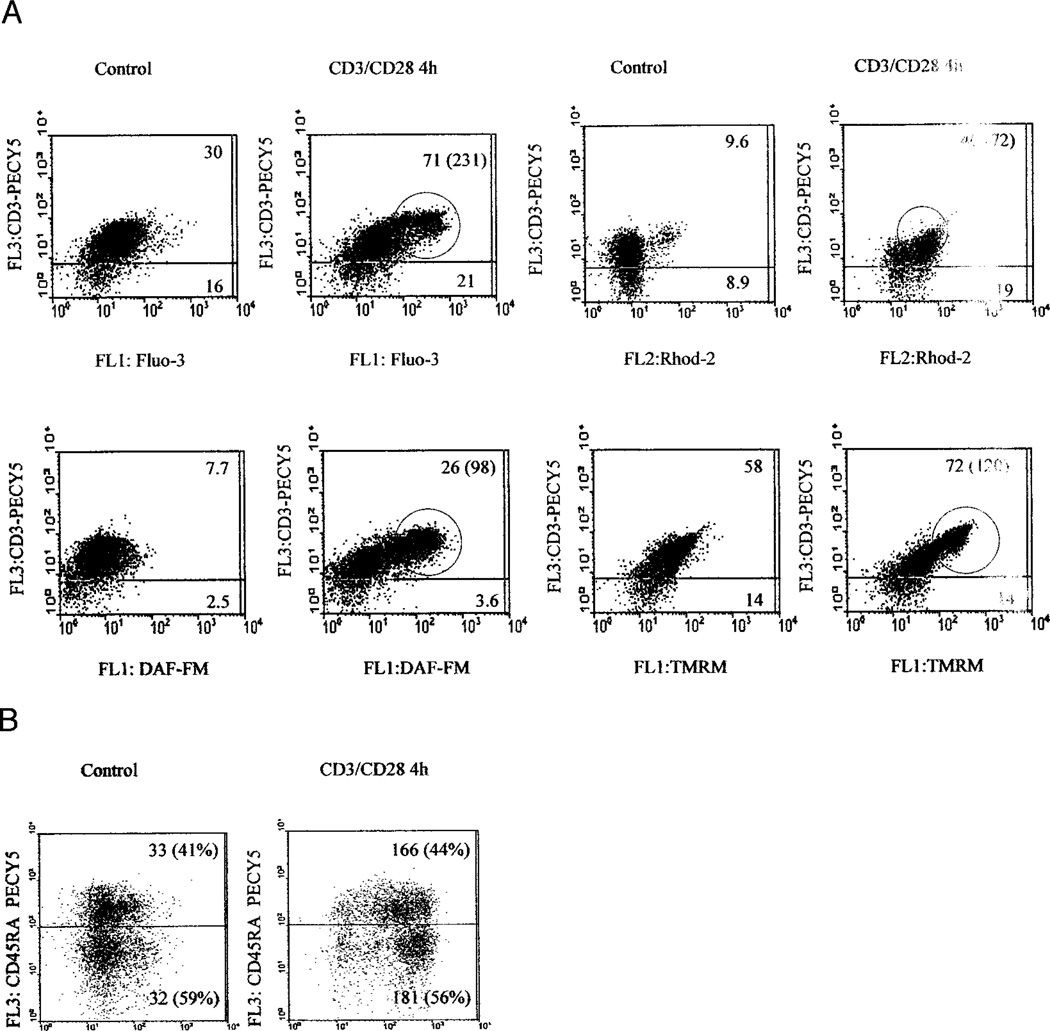
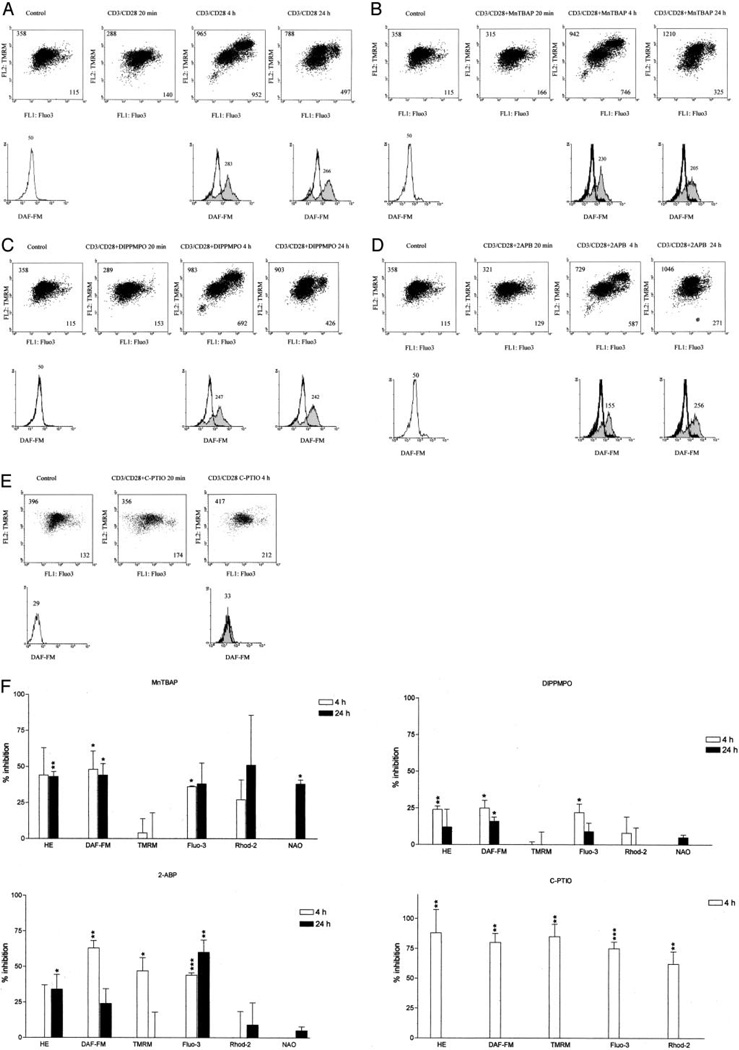
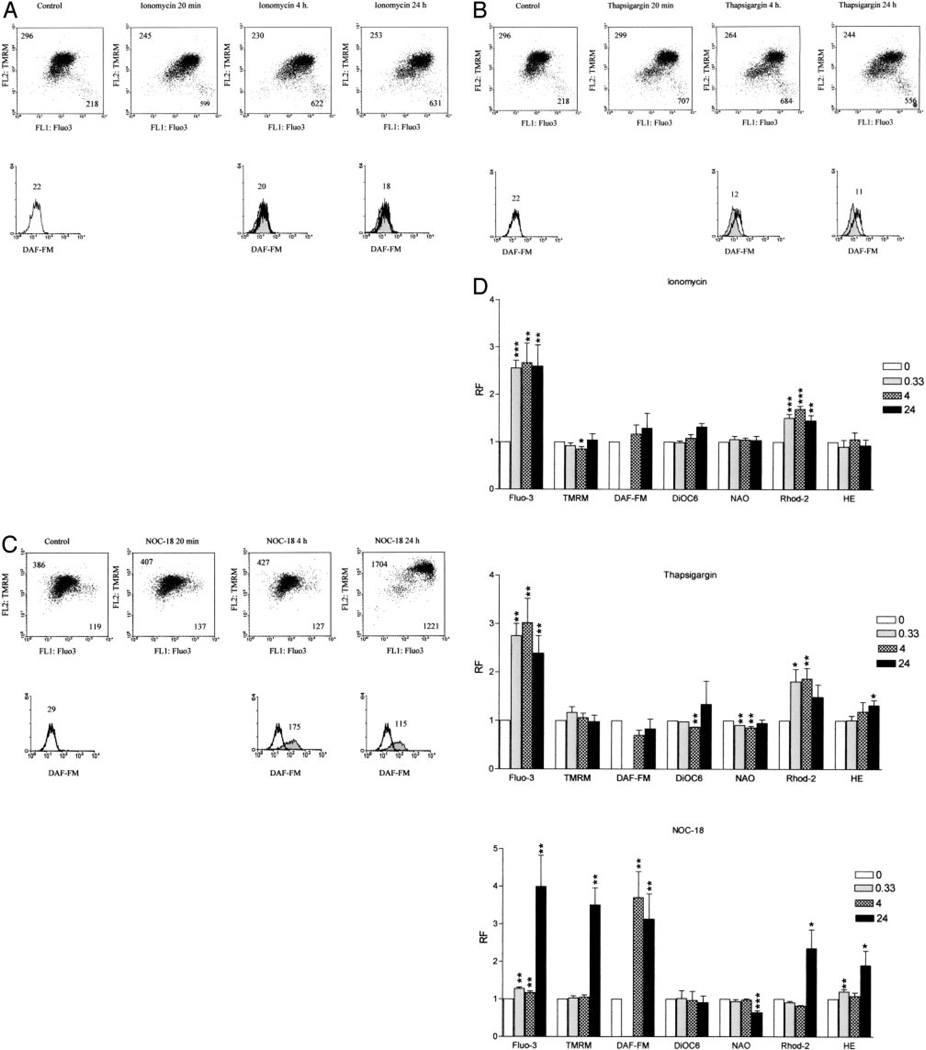
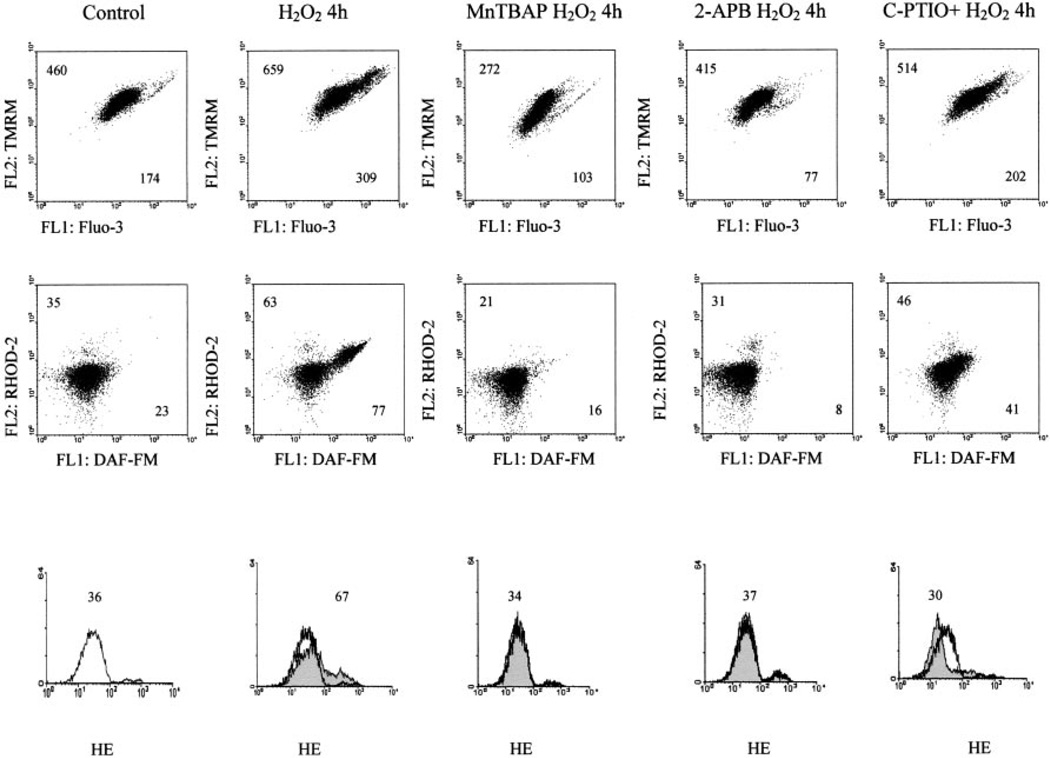
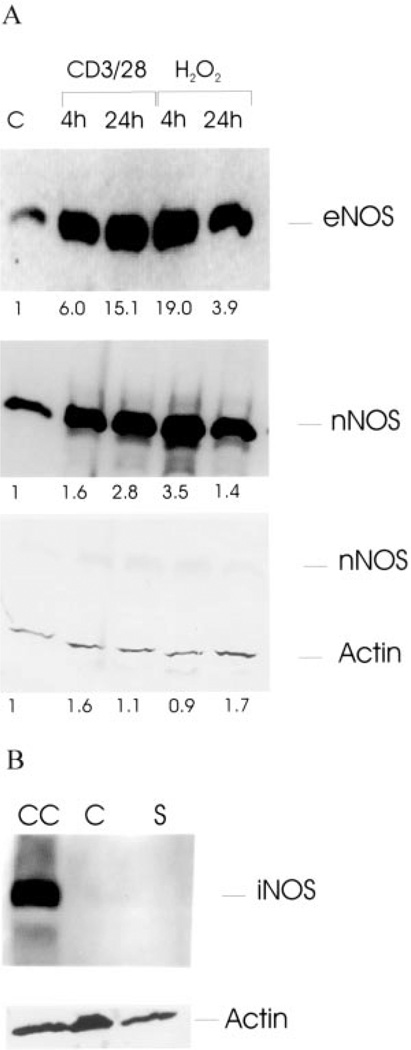
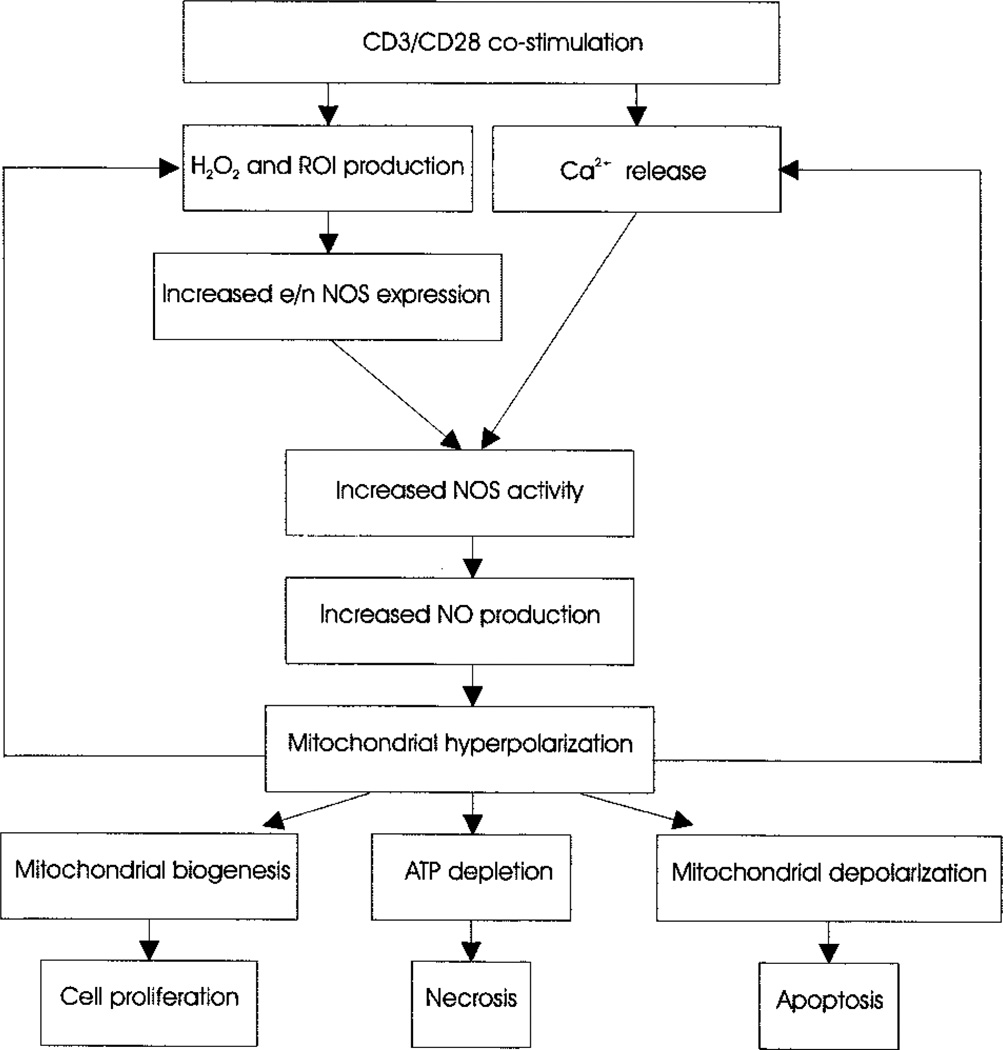
Activation, proliferation, or programmed cell death of T lymphocytes is regulated by the mitochondrial transmembrane potential (Deltapsi(m)) through controlling ATP synthesis, production of reactive oxygen intermediates (ROI), and release of cell death-inducing factors. Elevation of Deltapsi(m) or mitochondrial hyperpolarization is an early and reversible event associated with both T cell activation and apoptosis. In the present study, T cell activation signals leading to mitochondrial hyperpolarization were investigated. CD3/CD28 costimulation of human PBL elevated cytoplasmic and mitochondrial Ca(2+) levels, ROI production, and NO production, and elicited mitochondrial hyperpolarization. Although T cell activation-induced Ca(2+) release, ROI levels, and NO production were diminished by inositol 1,4,5-triphosphate receptor antagonist 2-aminoethoxydiphenyl borane, superoxide dismutase mimic manganese (III) tetrakis (4-benzoic acid) porphyrin chloride, spin trap 5-diisopropoxyphosphoryl-5-methyl-1-pyrroline-N-oxide, and NO chelator carboxy-2-phenyl-4,4,5,5-tetramethyl-imidazoline-1-oxyl-3-oxide, mitochondrial hyperpolarization was selectively inhibited by carboxy-2-phenyl-4,4,5,5-tetramethyl-imidazoline-1-oxyl-3-oxide (-85.0 +/- 10.0%; p = 0.008) and, to a lesser extent, by 2-aminoethoxydiphenyl borane. Moreover, NO precursor (Z)-1-[2-(2-aminoethyl)-N-(2-ammonioethyl)amino]diazen-1-ium-1,2-diolate diethylenetriamine elicited NO and ROI production, Ca(2+) release, transient ATP depletion, and robust mitochondrial hyperpolarization (3.5 +/- 0.8-fold; p = 0.002). Western blot analysis revealed expression of Ca-dependent endothelial NO synthase and neuronal NO synthase isoforms and absence of Ca-independent inducible NO synthase in PBL. CD3/CD28 costimulation or H(2)O(2) elicited severalfold elevations of endothelial NO synthase and neuronal NO synthase expression, as compared with beta-actin. H(2)O(2) also led to moderate mitochondrial hyperpolarization; however, Ca(2+) influx by ionomycin or Ca(2+) release from intracellular stores by thapsigargin alone failed to induce NO synthase expression, NO production, or Deltapsi(m) elevation. The results suggest that T cell activation-induced mitochondrial hyperpolarization is mediated by ROI- and Ca(2+)-dependent NO production.


Figures

FIGURE 1
FIGURE 1
Effect of CD3/CD28 costimulation on the Δψm, mitochondrial mass, ROI levels, cytoplasmic and mitochondrial Ca2+ levels, and NO production. Normal human PBL were treated with CD3/CD28 Abs and assayed after incubation at 37°C for 20 min (0.33 h), 4 h, and 24 h Δψm was monitored by TMRM and DiOC6; mitochondrial mass was measured by NAO; ROI production was assessed by HE; cytoplasmic and mitochondrial Ca2+ levels were assessed by Fluo-3 and Rhod-2; and NO production was monitored by DAF-FM fluorescence. Results were expressed as relative fluorescence (RF) values with respect to those of unstimulated cells normalized at 1.0. Data present mean ± SE of eight independent experiments. Values of p (*, <0.05; **, <0.01; ***, <0.001) above each column reflect comparison to untreated cells, whereas p values over brackets represent differences between the time points indicated.
FIGURE 2
FIGURE 2
A, Mitochondrial hyperpolarization is associated with increased NO production in T cells. Following CD3/CD28 costimulation, Δψm was measured by TMRM fluorescence (FL-2), cytoplasmic and mitochondrial Ca2+ levels were assessed by Fluo-3 (FL-1) and Rhod-2 fluorescence (FL-2), whereas NO production was monitored by DAF-FM fluorescence (FL-1). T cells were detected by staining with PE-Cy5-conjugated anti-CD3ε mAb UCHT1 (FL-3). Values in dot plots indicate mean channel fluorescence of CD3+ and CD3 cells, respectively. Values in parentheses correspond to encircled high-mean channel fluorescence population within the CD3+ T cell compartment, observed upon CD3/CD28 costimulation; B, Following CD3/CD28 costimulation, NO production was monitored by DAF-FM fluorescence (FL-1), and CD45RA T cells were detected by staining with PE-Cy5-conjugated anti-CD45RA mAb (FL-3).
FIGURE 3
FIGURE 3
Effect of MnTBAP, DIPPMPO, 2-APB, and C-PTIO on T cell activation-induced mitochondrial hyperpolarization, cytoplasmic and mitochondrial Ca2+ levels, and ROI and NO production. Values in dot plots (row 1) indicate mean channel FL-1 and FL-2 fluorescence, respectively. Values over histograms (row 2) indicate mean channel of DAF-FM fluorescence (FL-1). Histograms of CD3/CD28 costimulated cells (shaded curves) are overlaid on control cells (open curves); A, CD3/CD28 costimulation leads to mitochondrial hyperpolarization with appearance of a cell population with elevated Δψm, Ca2+ levels, and NO production; B, Effect of MnTBAP on CD3/CD28-induced elevation of Δψm Ca2+ levels, and NO production; C, Effect of DIPPMPO on CD3/CD28-induced elevation of Δψm, Ca2+ levels, and NO production; D, Effect of 2-APB on CD3/CD28-induced elevation of Δψm Ca2+ levels, and NO production; E, Effect of C-PTIO on CD3/CD28-induced elevation of Δψm Ca2+ levels, and NO production; F, Percentage of inhibition of T cell activation-induced changes in Δψm, mitochondrial mass, ROI levels, cytoplasmic and mitochondrial Ca2+ levels, and NO production monitored by TMRM, NAO, HE, Fluo-3, Rhod-2, and DAF-FM fluorescence, respectively. Data represent mean ± SE of four independent experiments. Values of p (*, <0.05; **, <0.01; ***, <0.001) above each column reflect comparison to untreated cells.
FIGURE 4
FIGURE 4
Effect of ionomycin (A), thapsigargin (B), and NOC-18 (C) on Δψm, Ca2+ levels, and NO production. Values in dot plots (row 1) indicate mean channel FL-1 and FL-2 fluorescence, respectively. Values over histograms (row 2) indicate mean channel of DAF-FM fluorescence (FL-1). Histograms of treated cells (shaded curves) are overlaid on control cells (open curves); D, Shown are ionomycin-, thapsigargin-, and NOC-18-induced changes in Δψm, mitochondrial mass, ROI levels, cytoplasmic and mitochondrial Ca2+ levels, and NO production monitored by TMRM, NAO, HE, Fluo-3, Rhod-2, and DAF-FM fluorescence, respectively. Data represent mean ± SE of four independent experiments. Values of p (*, <0.05; **, <0.01; ***, <0.001) above each column reflect comparison to untreated cells.
FIGURE 5
FIGURE 5
Effect of MnTBAP, 2-APB, and C-PTIO on H2O2-induced mitochondrial hyperpolarization, cytoplasmic and mitochondrial Ca2+ levels, and NO and ROI production as monitored by TMRM, Fluo-3, Rhod-2, DAF-FM, and HE fluorescence, respectively. Live-cell staining with annexin V-Cy5 (FL-3) (not shown) were analyzed. Values in dot plots reflect mean channel FL-1 and FL-2 fluorescence (rows 1 and 2). Values over histograms (row 3) indicate mean channel of HE fluorescence (FL-2). Histograms of H2O2-treated cells (shaded curves) are overlaid on untreated cells (open curves).
FIGURE 6
FIGURE 6
A, Western blot analysis of eNOS and nNOS expression in response to CD3/CD28 costimulation or treatment with 100 µM H2O2. Twenty micrograms of protein lysates were loaded in each lane, separated in a 7.5% SDS-PAGE gel, transferred to nitrocellulose, and probed with Abs specific for NOS isoforms eNOS and nNOS. Subsequently, blots were reprobed with control Ab to human β-actin. Values below lanes indicate relative expression of NOS isoforms in CD3/CD28- or H2O2-treated vs control PBL (C) calculated by automated densitometry using β-actin levels as baseline; B, Western blot analysis of iNOS expression in control (C) and CD3/CD28 costimulated PBL (S). CC, Chondrocyte protein lysate used as positive control for iNOS expression. Subsequently, the blot was reprobed with control Ab to human β-actin.
FIGURE 7
FIGURE 7
Schematic ordering of CD3/CD28 costimulation-induced mitochondrial signals in human T lymphocytes.

References

    1. Lenardo M, Chan KM, Hornung F, McFarland H, Siegel R, Wang J, Zheng L. Mature T lymphocyte apoptosis—immune regulation in a dynamic and unpredictable antigenic environment. Annu. Rev. Immunol. 1999;17:221. - PubMed
    1. Koretzky GA, Boerth NJ. The role of adapter proteins in T cell activation. Cell. Mol. Life Sci. 1999;56:1048. - PMC - PubMed
    1. Gringhuis SI, Leow A, Voort EAPapendrecht-Van Der, Remans PH, Breedveld FC, Verweij CL. Displacement of linker for activation of T cells from the plasma membrane due to redox balance alterations results in hyporesponsiveness of synovial fluid T lymphocytes in rheumatoid arthritis. J. Immunol. 2000;164:2170. - PubMed
    1. Lewis RS. Calcium signaling mechanisms in T lymphocytes. Annu. Rev. Immunol. 2001;19:497. - PubMed
    1. Gergely P, Jr, Niland B, Gonchoroff N, Pullmann R, Jr, Phillips PE, Perl A. Persistent mitochondrial hyperpolarization, increased reactive oxygen intermediate production, and cytoplasmic alkalinization characterize altered IL-10 signaling in patients with systemic lupus erythematosus. J. Immunol. 2002;169:1092. - PMC - PubMed

Publication types

MeSH terms

Substances