Comparative Study
. 2004 Jan 15;554(Pt 2):579-90.
doi: 10.1113/jphysiol.2003.056895. Epub 2003 Nov 7.

Tidal volume, cardiac output and functional residual capacity determine end-tidal CO2 transient during standing up in humans

Affiliations
Comparative Study

Tidal volume, cardiac output and functional residual capacity determine end-tidal CO2 transient during standing up in humans

Janneke Gisolf et al. J Physiol. .

Abstract

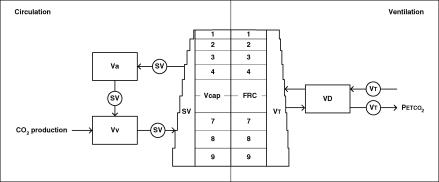
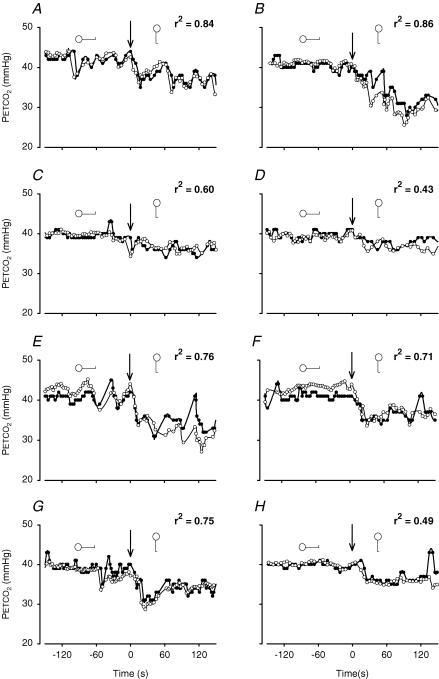
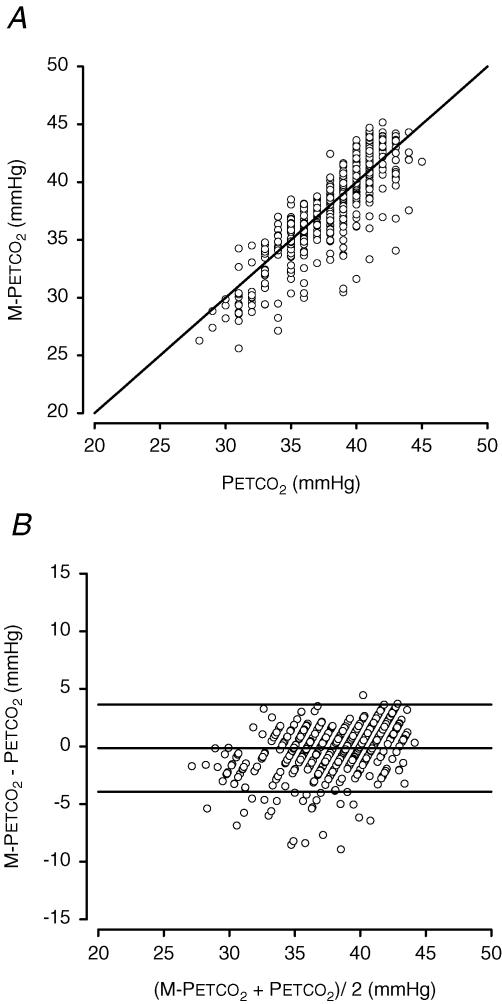
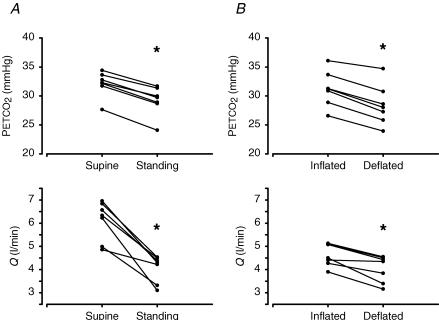
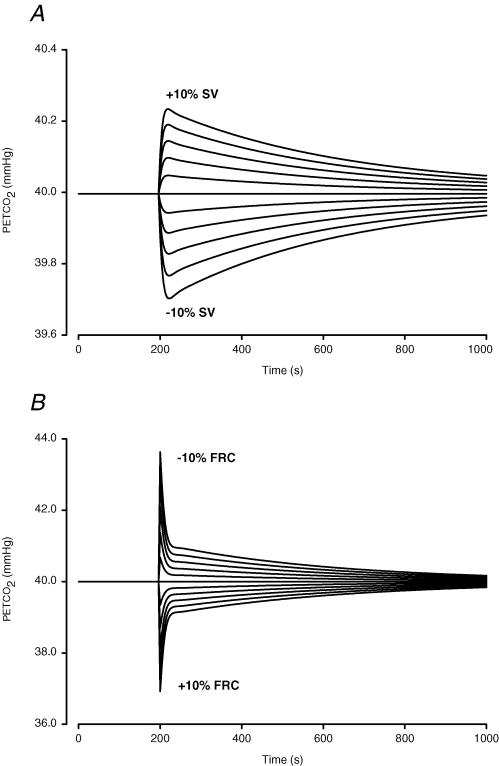
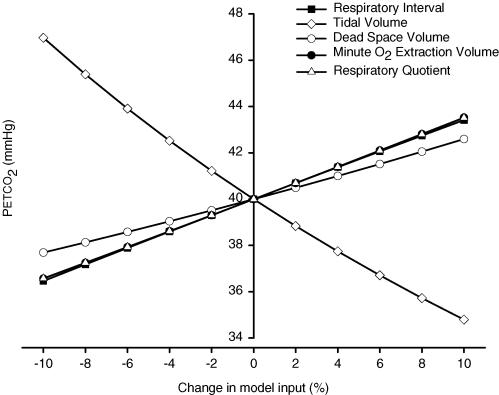
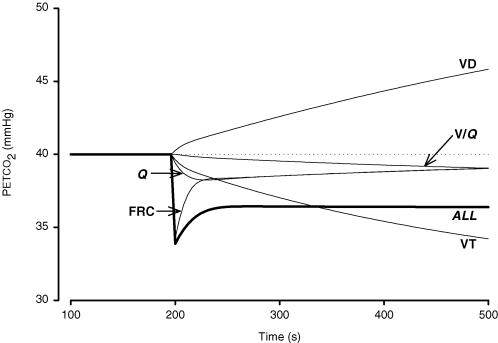
In man assuming the upright position, end-tidal P(CO(2)) (P(ETCO(2))) decreases. With the rising interest in cerebral autoregulation during posture change, which is known to be affected by P(ETCO(2)), we sought to determine the factors leading to hypocapnia during standing up from the supine position. To study the contribution of an increase in tidal volume (V(T)) and breathing frequency, a decrease in stroke volume (SV), a ventilation-perfusion (V/Q) gradient and an increase in functional residual capacity (FRC) to hypocapnia in the standing position, we developed a mathematical model of the lung to follow breath-to-breath variations in P(ETCO(2)). A gravity-induced apical-to-basal V/Q gradient in the lung was modelled using nine lung segments. We tested the model using an eight-subject data set with measurements of V(T), pulmonary O(2) uptake and breath-to-breath lumped SV. On average, the P(ETCO(2)) decreased from 40 mmHg to 36 mmHg after 150 s standing. Results show that the model is able to track breath-to-breath P(ETCO(2)) variations (r(2)= 0.74, P P 0.05). Model parameter sensitivity analysis demonstrates that the decrease in P(ETCO(2)) during standing is due primarily to increased V(T), and transiently to decreased SV and increased FRC; a slight gravity-induced V/Q mismatch also contributes to the hypocapnia. The influence of cardiac output on hypocapnia in the standing position was verified in experiments on human subjects, where first breathing alone, and then breathing, FRC and V/Q were controlled.


Figures

Figure 1
Figure 1. Diagram of the PETCO2 model
The left panel represents circulation with an arterial volume Va, a venous volume Vv, a lung capillary volume Vcap, and circulating stroke volume per breath SV. The right panel represents ventilation with a functional residual capacity FRC, a respiratory dead space VD, and a tidal volume VT. The distribution of SV and VT as shown here are for the upright position; in the supine position SV and VT are equally distributed over apical and basal lung segments (1–9).
Figure 2
Figure 2. Individual PETCO2 recordings and model simulations during lying down and standing
Plots of breath-to-breath PETCO2 of each individual subject. Subjects 1–8 are represented in panels AH, respectively. Each panel contains a plot of breath-to-breath PETCO2 measurements (•) during 150 s supine and 150 s of standing, and a model simulation (^) of the same period. Arrows indicate posture change from supine to standing at time zero.
Figure 3
Figure 3. Pooled data of 300 s of PETCO2 registration in 8 subjects, 150 s supine and 150 s standing, plotted against the output of a model run of the same time period
The number of data points is 583, representing the total of 583 breaths. A, pooled data of computed PETCO2 (M-PETCO2) plotted against measured PETCO2. B, pooled data scatter diagram of differences between measured PETCO2 and computed PETCO2 (M-PETCO2) against their mean. Horizontal lines indicate mean ± 1.96 s.d.
Figure 4
Figure 4. PETCO2 and Q during controlled breathing in 7 healthy subjects
Results of supine and standing (A) and inflated and deflated leg cuffs (B) protocols. Symbols represent average end-tidal PCO2 (top) and cardiac output (Q, bottom) during 5 min. The lines link the results of a particular subject. Asterisk indicates P < 0.01.
Figure 5
Figure 5. Parameter sensitivity analysis of SV and FRC
Each line represents a model run where after 200 breaths under baseline conditions the input is changed from its baseline value by –10 to +10%, in steps of 2%. In A the input is SV of the heart, in B the input is FRC. Note difference in ordinate scale.
Figure 6
Figure 6. Analysis of effect of each input variable on PETCO2
Parameter sensitivity analysis of model input (Tresp, VT, O2) and model parameters (VD and RQ). Model input is changed from baseline by –10 to +10% (see Methods) and model output (PETCO2) determined after 900 s.
Figure 7
Figure 7. Effect of active-standing induced variations in model input variables on PETCO2
Each thin line indicates the output of a model run starting with supine settings and with parameter settings varied at 200 s as is likely to occur on standing up: Q, output when Q was reduced by 40%, VT, output when VT was increased by 20%, FRC, output when FRC was increased by 20%, VD, output when VD was increased by 70 ml, V/Q, output when V/Q shifted from equal distribution to model settings for a gravitationally induced V/Q mismatch. The thick line labelled ALL indicates model PETCO2 levels when all of these changes occurred simultaneously.

References

    1. Anthonisen NR, Milic-Emili J. Distribution of pulmonary perfusion in erect man. J Appl Physiol. 1966;21:760–766. - PubMed
    1. Birch AA, Dirnhuber MJ, Hartley-Davies R, Iannotti F, Neil-Dwyer G. Assessment of autoregulation by means of periodic changes in blood pressure. Stroke. 1995;26:834–837. - PubMed
    1. Bjurstedt H, Hesser CM, Liljestrand G, Matell G. Effects of posture on alveolar-arterial CO2 and O2 differences and on alveolar dead space in man. Acta Physiol Scand. 1962;54:65–82. - PubMed
    1. Blumenthal SR, Voorhees WD. The relationship between airway carbon dioxide excretion and cardiac output during cardiopulmonary resuscitation. Resuscitation. 1997;34:263–270. - PubMed
    1. Bryan AC, Milic-Emili J, Pengelly D. Effect of gravity on the distribution of pulmonary ventilation. J Appl Physiol. 1966;21:778–784. - PubMed

Publication types