Comparative Study
. 2004 Jan 15;554(Pt 2):321-34.
doi: 10.1113/jphysiol.2003.046995. Epub 2003 Nov 7.

Different flecainide sensitivity of hNav1.4 channels and myotonic mutants explained by state-dependent block

Affiliations
Comparative Study

Different flecainide sensitivity of hNav1.4 channels and myotonic mutants explained by state-dependent block

Jean-François Desaphy et al. J Physiol. .

Erratum in

  • J Physiol. 2004 Mar 16;555(Pt 3):851. Luca, Annamaria D E [corrected to De Luca, Annamaria]

Abstract

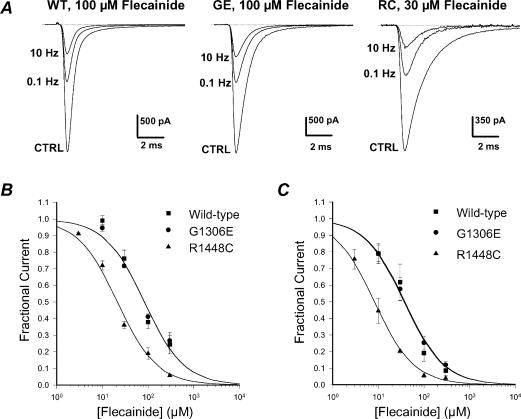
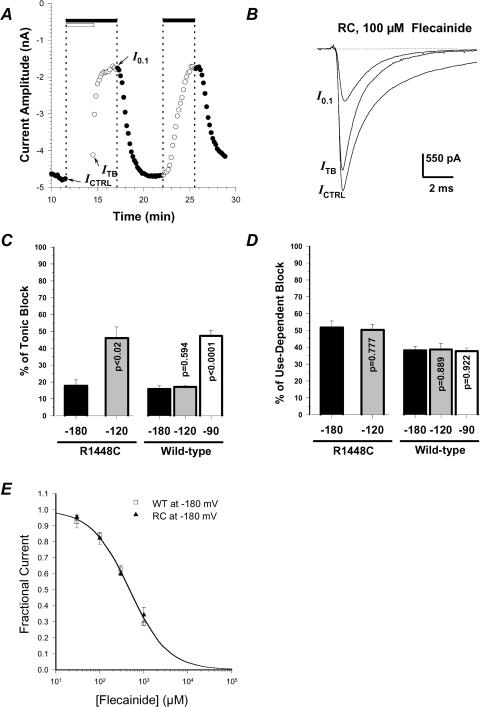
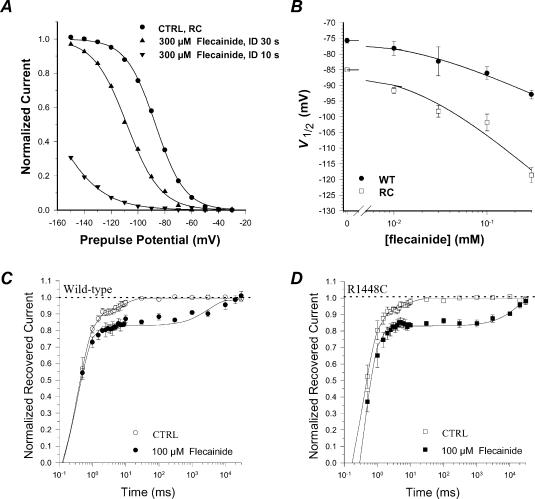
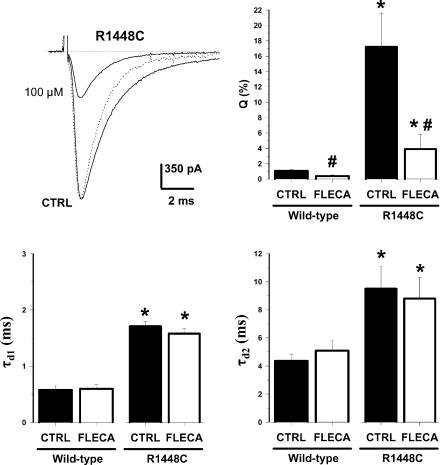
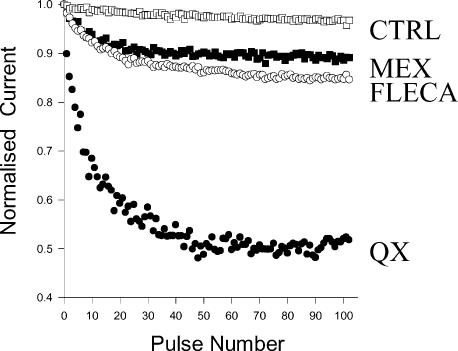
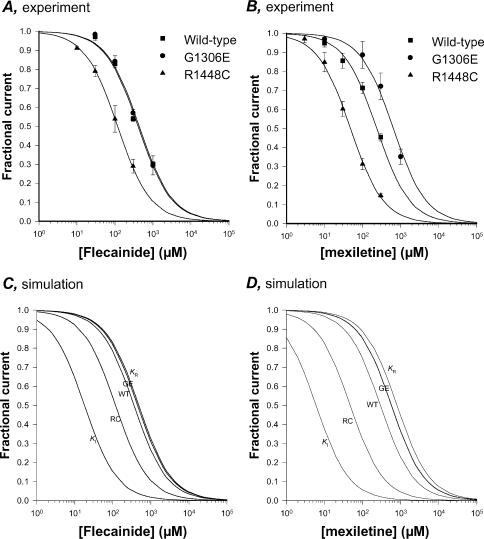
Flecainide, a class IC antiarrhythmic, was shown to improve myotonia caused by sodium channel mutations in situations where the class IB antiarrhythmic drug mexiletine was less efficient. Yet little is known about molecular interactions between flecainide and human skeletal muscle sodium (hNa(v)1.4) channels. Whole-cell sodium currents (I(Na)) were recorded in tsA201 cells expressing wild-type (WT) and mutant hNa(v)1.4 channels (R1448C, paramyotonia congenita; G1306E, potassium-aggravated myotonia). At a holding potential (HP) of -120 mV, flecainide use-dependently blocked WT and G1306E I(Na) equally but was more potent on R1448C channels. For WT, the extent of block depended on a holding voltage more negative than the activation threshold, being greater at -90 mV as compared to -120 and -180 mV. This behaviour was exacerbated by the R1448C mutation since block at -120 mV was greater than that at -180 mV. Thus flecainide can bind to inactivated sodium channels in the absence of channel opening. Nevertheless, all the channels showed the same closed-state affinity constant (K(R) approximately 480 microM) and the same inactivated-state affinity constant (K(I) approximately 18 microM). Simulations according to the modulated receptor hypothesis mimic the voltage-dependent block of WT and mutant channels by flecainide and mexiletine. All the results suggest similar blocking mechanisms for the two drugs. Yet, since flecainide exerts use-dependent block at lower frequency than mexiletine, it may exhibit greater benefit in all myotonic syndromes. Moreover, flecainide blocks hNa(v)1.4 channel mutants with a rightward shift of availability voltage dependence more specifically than mexiletine, owing to a lower K(R)/K(I) ratio. This study offers a pharmacogenetic strategy to better address treatment in individual myotonic patients.


Figures

Figure 1
Figure 1. Frequency-dependent flecainide block of wild-type and mutant hNav1.4 channels at a holding potential of –120 mV
A, block of sodium currents by flecainide was assessed 3 min after drug application by measuring the reduction of INa elicited from –120 to –30 mV at stimulation frequencies of 0.1 Hz and 10 Hz. B, concentration–response curves for flecainide block were constructed at 0.1 Hz using the protocol described in A and fitted with eqn (1) (see Results). Each data point is the mean ± s.e.m. of at least 3 cells. The calculated IC50 values ± s.e. of the fit were 83.5 ± 16.9 μm for WT, 82.8 ± 11.2 μm for G1306E, and 21.4 ± 2.2 μm for R1448C. C, concentration–response curves for flecainide block were constructed at 10 Hz using the protocol described in A and fitted with eqn (1) (see Results). Each data point is the mean ± s.e.m. of at least 3 cells. The calculated IC50 values ± s.e. of the fit were 36.6 ± 6.1 μm for WT, 38.2 ± 1.8 μm for G1306E, and 8.2 ± 0.4 μm for R1448C.
Figure 2
Figure 2. Effect of holding potential on flecainide block of wild-type and R1448C hNav1.4 channels and flecainide affinity for closed channels
A, time course evolution of peak INa amplitude in a tsA201 cell expressing R1448C channels. The cell was held at the HP of –180 mV and depolarized to –30 mV at 0.1 Hz frequency, except under the open bar where the HP was maintained with no depolarization for determination of tonic block (ITB). The filled bars indicate application of 100 μm flecainide. B, traces of R1448C INa measured at the times indicated by arrows in A. ICTRL was measured just before application of the drug, while I0.1 was measured when steady-state block was reached at 0.1 Hz stimulation frequency. C and D, tonic block is expressed as 100 × (ICTRLITB)/ICTRL, while use-dependent block is expressed as 100 × (ITBI0.1)/ICTRL, measured as in A with HP =–180, –120 and –90 mV. Each bar corresponds to the mean ± s.e.m. of at least 4 cells. The P-values reported on bars were calculated using Student's unpaired t test versus respective block at HP =–180 mV. In addition, use-dependent block of R1448C channels was significantly greater than that of WT channels (at least P < 0.02). E, concentration–response curves were constructed for ITB/ICTRL measured as in A at HP =–180 mV and fitted with eqn (1). Each data point is the mean ± s.e.m. of at least 4 cells. The calculated IC50 values ± s.e. of the fit were 469.0 ± 31.8 μm for WT and 481.2 ± 21.4 μm for R1448C.
Figure 3
Figure 3. Flecainide affinity for inactivated wild-type and R1448C hNav1.4 channels and recovery from flecainide block
A, effects of flecainide on voltage dependence of INa availability in a tsA201 cell expressing R1448C channels. INa was evoked by a 20 ms-long test pulse to –30 mV after a 50 ms-long conditioning pulses to potentials ranging from –150 to –30 mV in 10 mV increments. Pulses were delivered at 10 s or 30 s interval duration (ID) as indicated and HP was –180 mV. The peak INa recorded during the test pulse was plotted against the conditioning pulse potential. The relationships were fitted with eqn (2) (see Results). The values of the half-maximum inactivation potential, V1/2, along with the s.e. of the fit were –87.0 ± 0.2 mV in control, –108.2 ± 0.4 mV in the presence of 300 μm flecainide with 30 s ID, and –164.7 ± 0.8 in the presence of 300 μm flecainide with 10 s ID. The values of the slope factor, S, were 11.0 ± 0.2 mV in control, 12.6 ± 0.3 mV in the presence of 300 μm flecainide with 30 s ID, and 17.9 ± 0.6 mV in the presence of 300 μm flecainide with 10 s ID. Availability curves were normalized with respect to their own INa,max. B, the affinity of flecainide for inactivated channels (KI) was evaluated by plotting V1/2 values, determined as in A, against flecainide concentration. Each data point is the mean ± s.e.m. from at least 4 cells. The relationships were fitted with eqn (3) (see Results). The values of KI along with the s.e. of the fit were 17.1 ± 1.1 μm for WT (V1/2,CTRL was –75.7 mV and SCTRL was 5.8 mV in eqn (3)) and 17.8 ± 2.9 μm for R1448C channels (V1/2,CTRL was –85.0 mV and SCTRL was 11.1 mV). C and D, the recovery of WT and R1448C channels from inactivation and from flecainide block was measured at –180 mV. A recovery pulse at the HP of increasing duration was included between two test pulses at –30 mV. The peak INa recorded during the second test pulse was normalized with respect to the peak INa recorded during the first test pulse and means ± s.e.m. were calculated from at least 5 cells to be plotted against the recovery time. The relationships were fitted with eqn (4) (see Results). Fitted parameters are reported in Table 1.
Figure 4
Figure 4. Effects of flecainide on INa decay rate of WT and R1448C hNav1.4 channels
The INa was evoked by 25 ms-long test pulses to –30 mV applied at 0.1 Hz from the V1/2 of –180 mV before (CTRL) and after application of 100 μm flecainide. To allow direct inspection of drug effect on current decay, INa measured during drug exposure was scaled with respect to peak amplitude of control INa (dashed line). The parameters τd1, τd2 and Q were calculated form the fit of current decay with eqn (5). Each bar represents the mean ± s.e.m. from 8 (WT) and 11 cells (R1448C). Statistical analysis was performed using Student's paired t test, * indicating at least P < 0.01 versus CTRL wild-type and # indicating at least P < 0.02versus relative control.
Figure 5
Figure 5. Effects of internal application of drugs on wild-type hNav1.4 channels
Development of use-dependent block after internal diffusion of control pipette solution (CTRL, □), or pipette solution supplemented with 1 mm mexiletine (MEX, ▪), 1 mm flecainide (FLECA, ○), or 300 μm QX-314 (QX, •). The tsA201 cells expressing WT hNav1.4 channels were held at –120 mV and received a 25 ms-long depolarizing pulse to –30 mV every 0.1 s (10 Hz) to elicit INa. This protocol was applied about 5 min after achieving the whole-cell configuration to allow pipette solution to diffuse well within the cell. Peak INa measured at each test pulse was normalized with respect to the first pulse INa. Each data point is the mean from at least 3 cells.
Figure 6
Figure 6. Simulation of flecainide and mexiletine effects on hNav1.4 channels using the modulated receptor model
A and B, experimental concentration–response curves for flecainide and mexiletine effect on wild-type, R1448C, and G1306E hNav1.4 channels were constructed at a holding potential (HP) of –120 mV in absence of depolarization as described in Fig. 2. Each data point is the mean ± s.e.m. of at least 3 cells. The relationships were fitted with eqn (1) (see Results) and the IC50 values are reported in Table 2. C and D, the theoretical curves according to the modulated receptor hypothesis were built using eqn (1) (see Results) with the KAPP values calculated for WT, G1306E, and R1448C channels using eqn (6) at a HP of –120 mV and reported in Table 2. The lines labelled with KR and KI were obtained using KR and KI values reported in Table 2 for each drug and describe the theoretical relationships for a hypothetical pure block of closed channels (KR) and a hypothetical pure block of inactivated channels (KI).

References

    1. Abriel H, Wehrens XHT, Benhorin J, Kerem B, Kass RS. Molecular pharmacology of the sodium channel mutation D1790G linked to the long-QT syndrome. Circulation. 2000;102:921–925. - PubMed
    1. American Heart Association. International guidelines for cardiopulmonary resuscitation and emergency cardiovascular care. Part 6: Advanced Cardiovascular Life Support: Section 5: Pharmacology I: Agents for Arrhythmias. Circulation. 2000;102:I112–I128. - PubMed
    1. Anno T, Hondeghem LM. Interactions of flecainide with guinea pig cardiac sodium channels. Importance of activation unblocking to the voltage-dependence of recovery. Circ Res. 1990;66:789–803. - PubMed
    1. Bean BP, Cohen CJ, Tsien RW. Lidocaine block of cardiac sodium channels. J General Physiol. 1983;81:613–642. - PMC - PubMed
    1. Bendahhou S, Cummins TR, Kwiecinski H, Waxman SG, Ptacek LJ. Characterization of a new sodium channel mutation at arginine 1448 associated with moderate paramyotonia congenita in humans. J Physiol. 1999;518:337–344. - PMC - PubMed

Publication types

MeSH terms