. 2003 Dec 9;100(25):15059-64.
doi: 10.1073/pnas.2334901100. Epub 2003 Nov 7.

Mouse glucocorticoid-induced tumor necrosis factor receptor ligand is costimulatory for T cells

Affiliations

Mouse glucocorticoid-induced tumor necrosis factor receptor ligand is costimulatory for T cells

Masahide Tone et al. Proc Natl Acad Sci U S A. .

Abstract

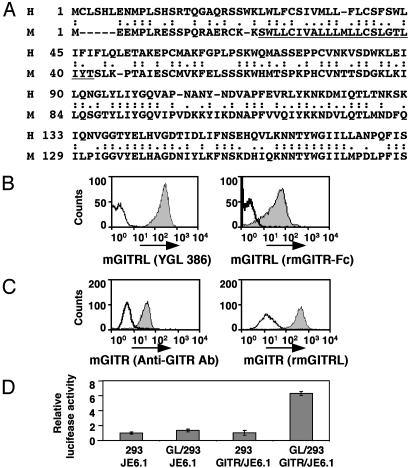
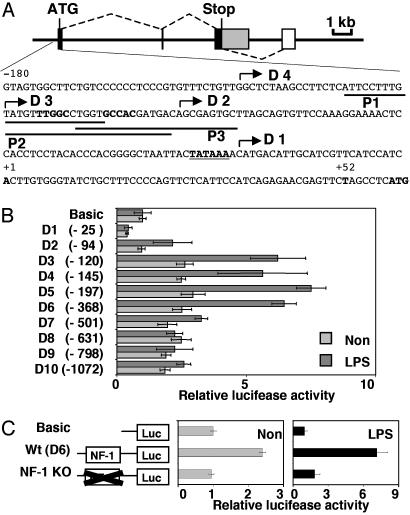
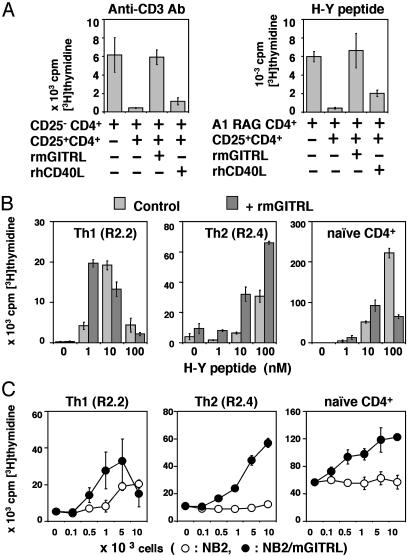
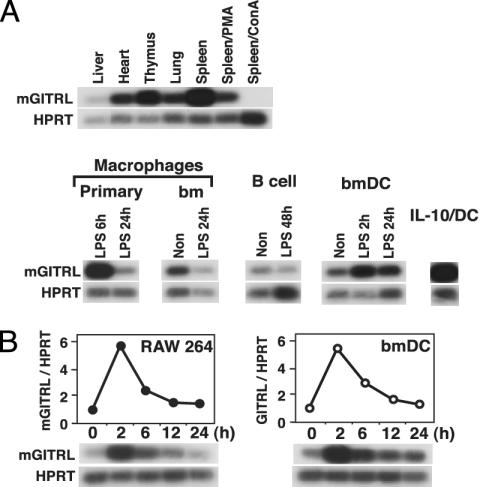
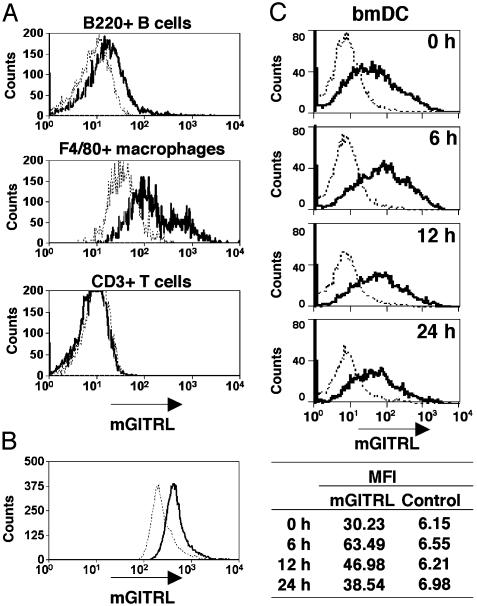
Recently, agonist antibodies to glucocorticoid-induced tumor necrosis factor receptor (GITR) (tumor necrosis factor receptor superfamily 18) have been shown to neutralize the suppressive activity of CD4+CD25+ regulatory T cells. It was anticipated that this would be the role of the physiological ligand. We have identified and expressed the gene for mouse GITR ligand and have confirmed that its interaction with GITR reverses suppression by CD4+CD25+ T cells. It also, however, provides a costimulatory signal for the antigen-driven proliferation of naïve T cells and polarized T helper 1 and T helper 2 clones. RT-PCR and mAb staining revealed mouse GITR ligand expression in dendritic cells, macrophages, and B cells. Expression was controlled by the transcription factor NF-1 and potentially by alternative splicing of mRNA destabilization sequences.


Figures

Fig. 1.
Fig. 1.
Identification of mGITRL. (A) Amino acid sequences of human (H) and mouse (M) GITRL are aligned. The predicted transmembrane domain is underlined. (B) Binding of GITR and the putative mGITRL was analyzed by using recombinant GITR-Fc and transfectants expressing this ligand. The putative mGITRL transfectants (filled with gray) and nontransfectants (solid line) were stained with mAb (YGL 386) or recombinant mGITR-Fc (rmGITR-Fc). (C) Binding of mGITR and the mGITRL was analyzed by using mGITR transfectants and recombinant protein of this ligand. mGITR transfectants (filled with gray) and nontransfectants (solid line) were stained with anti-GITR antibody (Anti-GITR Ab) or the recombinant putative mGITRL (rmGITRL). Binding of the recombinant protein was detected with anti-His tag antibody. (D) Signaling through mGITR with the mGITRL was analyzed by a luciferase assay using the NF-κB reporter plasmid. mGITR transfectant (GITR/JE6.1) and nontransfectant (JE6.1) were electroporated with the NF-κB reporter plasmid. Five hours postelectroporation, these cells were harvested and mixed with either growth-arrested (by mitomycin C treatment) HEK293/mGITRL transfectants (GL/293) or HEK293 (293). Mixed combinations are indicated under the graph. Luciferase activities generated these cells were compared with that in JE6.1 with HEK293.
Fig. 5.
Fig. 5.
Gene structure and promoter activity of mGITRL. (A) Coding exons are indicated by black boxes, and a 3′ noncoding region is indicated by a gray box. An alternative 3′ noncoding exon is indicated by a white box. Splice joints are indicated by dotted lines. Partial promoter and 5′ noncoding sequences are shown under mGITRL gene structure. A major transcription start site (+1), the 3′ end (+52) of the promoter fragments in the luciferase reporter plasmids (in B), and the first ATG are indicated in bold. The TATA box sequence is indicated in bold and underlined. 5′ Ends of the promoter fragments in the luciferase reporter plasmids (in B, D1-D4) are indicated by arrows, and the locations of probes P1, P2, and P3 for EMSA (in Fig. 6A) are indicated by solid lines. (B and C) mGITRL promoter activity was analyzed by luciferase assays. Luciferase activity generated using the reporter plasmids were compared with that generated using the negative control plasmid (no insert) pGL3-Basic Vector (Basic) in nonstimulated and LPS-stimulated RAW 264 cells. These assays were repeated at least three times. (B) The luciferase reporter plasmids were constructed by using the mGITRL promoter fragments. The 5′ end of each promoter fragment is indicated in parentheses. (C) The NF-1 site in the luciferase reporter D6 (in B) was mutated, and the structure of these plasmids used in the luciferase assay are illustrated. The mutated NF-1 site (TTGGCCTGGTGCCAC to TGGCCTGGGAATTC) is indicated (X).
Fig. 2.
Fig. 2.
Enhancement and inhibition of proliferation of TCR-stimulated T cells with mGITRL. (A) Proliferation assays were performed by using CD4+CD25- cells stimulated with mitomycin C-treated T cell-depleted female spleen cells and anti-CD3 antibody (Anti-CD3 Ab) or H-Y peptide as antigen (H-Y peptide). CD4+CD25+ cells, recombinant mGITRL (rmGITRL), and/or recombinant hCD40L (rhCD40L) were added (marked +). For peptide assays, CD4+CD25+ were preactivated. Control cultures where CD4+CD25- from CBA/Ca mice were added failed to induce suppression (data not shown). (B) Proliferation assays were performed by using Th1 (R2.2), Th2 (R2.4) clones, and naïve CD4+ cells from A1(M)RAG-1-/- mice, with or without recombinant mGITRL. These T cells were stimulated with mitomycin C-treated female spleen cells and different amounts of H-Y peptide as antigen (0-100 nM). (C) Proliferation assays were performed by using Th1 (R2.2), Th2 (R2.4) clones, and naïve CD4+ cells from A1(M)RAG-1-/- mice with or without mitomycin C-treated mGITRL transfectants (NB2/mGITRL) or its parent cells (NB2) (0-104 cells). These T cells were stimulated with mitomycin C-treated female spleen cells and 10 nM of H-Y peptide as antigen.
Fig. 3.
Fig. 3.
Expression levels of mGITRL mRNA. Expression levels of mGITRL mRNA were analyzed by RT-PCR. cDNAs were amplified with mGITRL-specific or HPRT-specific primers. To compare expression levels and minimize PCR artifacts, the number of PCR cycles was kept low, and PCR products were detected by Southern blot hybridization using specific probes. (A) cDNAs were prepared by using RNA from indicated organs and cells with an oligo(dT) primer. Preparation of primary and bm macrophages, splenic B cell-enriched fraction, bmDC, and IL-10/DC was described in Materials and Methods. If required, cells were stimulated with LPS (10 μg/ml). RT-PCR using RNA from nonstimulated primary macrophage was not performed because it is extremely difficult to purify nonstimulated macrophages by the method used for purification of LPS-stimulated macrophages. (B) RT-PCR was performed by using RNA from nonstimulated (0 h) and LPS-stimulated (2-24 h) RAW 264 cells or bmDC. LPS stimulation times are indicated above the blot. RT-PCR results were also analyzed by using PhosphorImaging, allowing mRNA levels of mGITRL to be compared with those of HPRT (shown above the blot).
Fig. 4.
Fig. 4.
Cell surface expression of mGITRL. (A) Spleen cells were stained with anti-mGITRL antibody YGL386 (solid line) or an isotype control antibody (dotted line). These cells were costained with anti-CD3, anti-B220, or anti-F4/80 antibody and then positive cells were gated. Median fluorescence intensity (MFI) is as follows: B220+ B cell (control, 7.7; mGITRL, 14.9), F4/80+ macrophages (control, 25.4; mGITRL low, 56.2; mGITRL high, 673.2), and CD3+ T cell (control, 11.2; mGITRL, 9.65). (B) Peritoneal cells were also stained with anti-mGITRL antibody YGL386 (solid line) or an isotype control antibody (dotted line). Cells were costained with anti-F4/80 antibody and then positive cells were gated. MFI are: control, 254.8 and mGITRL, 421.7. (C) Nonstimulated (0 h) and LPS-stimulated (6, 12, and 24 h) bmDCs were stained with anti-mGITRL antibody YGL 386 (solid line) or an isotype control antibody (dotted line). bmDC were costained with an anti-CD11c antibody (DC maker), and positive cells were gated. MFI values are indicated under the histograms.
Fig. 6.
Fig. 6.
Binding of transcription factor NF-1 to the mGITRL promoter. (A) The presence of cis-acting elements between -120 and -94 is suggested by luciferase assays (Fig. 5B). Oligo probes P1 to P3 for EMSA were designed in this identified region and its flanking regions. The locations of these probes are indicated in Fig. 5A. EMSA was performed by using the probes (P1-P3) and nuclear extract from RAW 264 cells. (B) A competition assay was performed by using a 100-fold excess of unlabeled competitor with 32P-labeled P2 probe. The competitors used are indicated above the gel. Probe P2 sequence and mutated sequences in M1 and M2 are shown under the gel. Sequence similar to NF-1 consensus in P2 is indicated with underlines. (C) Super shift assay was performed by using probe P2 and an anti-NF-1 antibody (marked +). (D) EMSA was performed by using probe P2 and nuclear extracts from nonstimulated (0 h) and LPS-stimulated (2-24 h) RAW 264 cells. NF-1 and probe complexes are indicated. (E) EMSA was performed by using probe P2 and nuclear extracts from nonstimulated (0 h) and LPS-stimulated (2-24 h) bmDC (EMSA). NF-1 in nuclear extracts used for EMSA was detected by immunoblotting using anti-NF-1 antibody (IB).

Comment in

  • Costimulatory signals controlling regulatory T cells.
    Ermann J, Fathman CG. Ermann J, et al. Proc Natl Acad Sci U S A. 2003 Dec 23;100(26):15292-3. doi: 10.1073/pnas.0307001100. Epub 2003 Dec 15. Proc Natl Acad Sci U S A. 2003. PMID: 14676329 Free PMC article. No abstract available.

References

    1. Nocentini, G., Giunchi, L., Ronchetti, S., Krausz, L. T., Bartoli, A., Moraca, R., Migliorati, G. & Riccardi, C. (1997) Proc. Natl. Acad. Sci. USA 94, 6216-6221. - PMC - PubMed
    1. Gurney, A. L., Marsters, S. A., Huang, R. M., Pitti, R. M., Mark, D. T., Baldwin, D. T., Gray, A. M., Dowd, A. D., Brush, A. D., Heldens, A. D., et al. (1999) Curr. Biol. 9, 215-218. - PubMed
    1. Kwon, B., Yu, K.-Y., Ni, J., Yu, G.-L., Jang, I.-K., Kim, Y.-J., Xing, L., Liu, D., Wang, S.-X. & Kwon, B. S. (1999) J. Biol. Chem. 274, 6056-6061. - PubMed
    1. McHugh, R. S., Whitters, M. J., Piccirillo, C. A., Young, D. A., Shevach, E. M., Collins, M. & Byrne, M. C. (2002) Immunity 16, 311-323. - PubMed
    1. Shimizu, J., Yamazaki, S., Takahashi, T., Ishida, Y. & Sakaguchi, S. (2002) Nat. Immunol. 3, 135-142. - PubMed

Publication types

MeSH terms

Associated data