

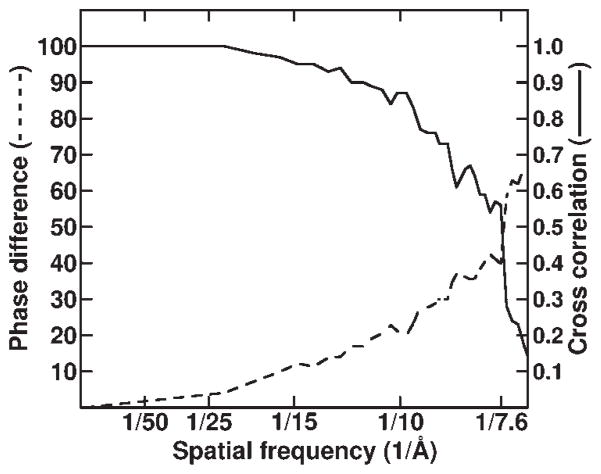
Reovirus polymerase lambda 3 localized by cryo-electron microscopy of virions at a resolution of 7.6 A
- PMID: 14608373
- PMCID: PMC4152824
- DOI: 10.1038/nsb1009
Reovirus polymerase lambda 3 localized by cryo-electron microscopy of virions at a resolution of 7.6 A
Abstract
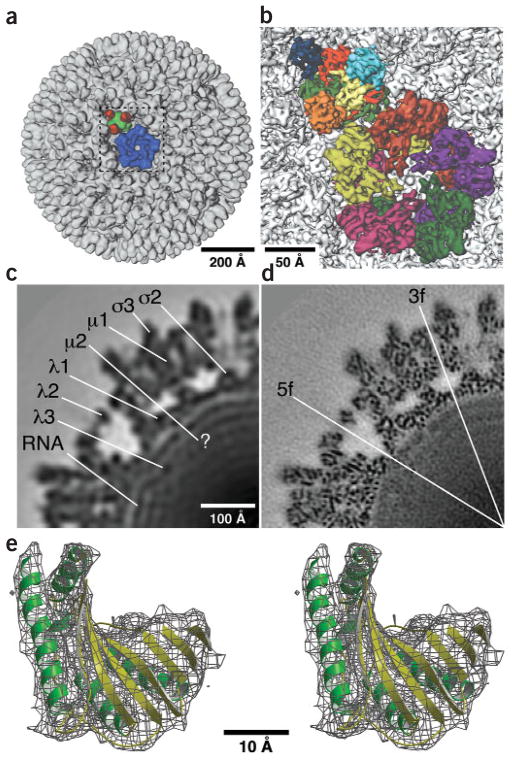
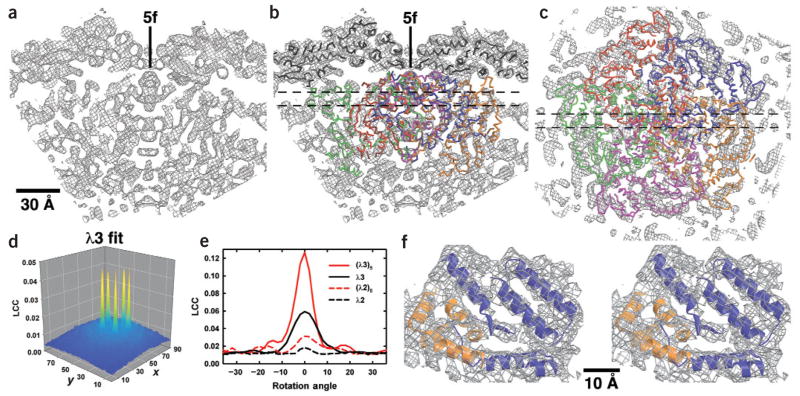
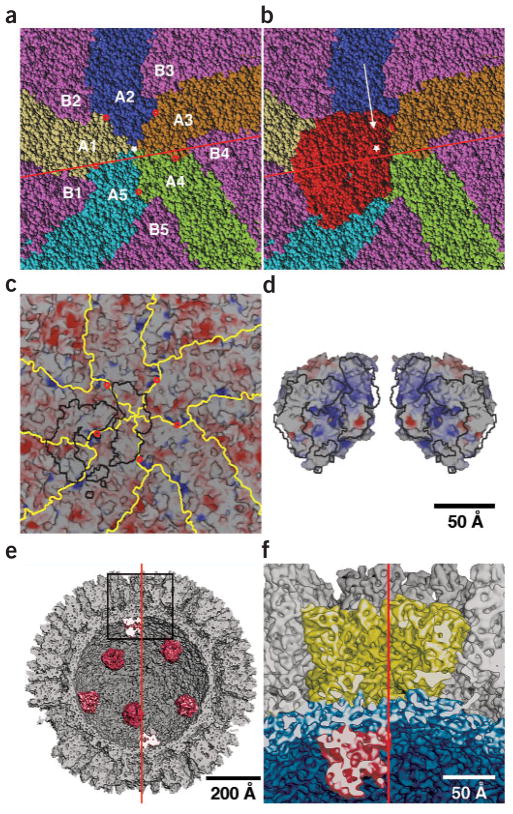
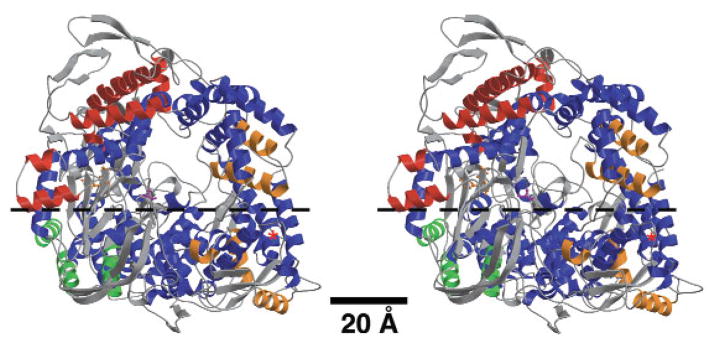
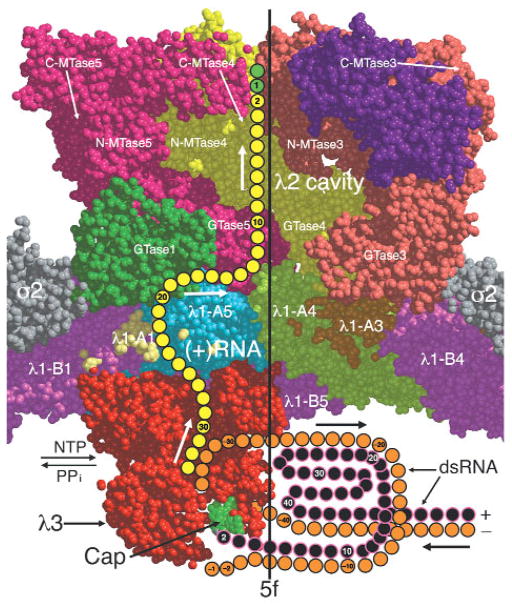
Reovirus is an icosahedral, double-stranded (ds) RNA virus that uses viral polymerases packaged within the viral core to transcribe its ten distinct plus-strand RNAs. To localize these polymerases, the structure of the reovirion was refined to a resolution of 7.6 A by cryo-electron microscopy (cryo-EM) and three-dimensional (3D) image reconstruction. X-ray crystal models of reovirus proteins, including polymerase lambda 3, were then fitted into the density map. Each copy of lambda 3 was found anchored to the inner surface of the icosahedral core shell, making major contacts with three molecules of shell protein lambda 1 and overlapping, but not centering on, a five-fold axis. The overlap explains why only one copy of lambda 3 is bound per vertex. lambda 3 is furthermore oriented with its transcript exit channel facing a small channel through the lambda 1 shell, suggesting how the nascent RNA is passed into the large external cavity of the pentameric capping enzyme complex formed by protein lambda 2.
Conflict of interest statement
The authors declare that they have no competing financial interests.
Figures
References
-
- Nibert ML, Schiff LA, Fields BN. Reoviruses and their replication. In: Fields BN, Knipe DM, Howley PM, editors. Fields Virology. Raven; Philadelphia: 2001. pp. 1679–1728.
Publication types
MeSH terms
Substances
Grants and funding
LinkOut - more resources
Full Text Sources
Other Literature Sources