. 2003 Dec;122(6):657-71.
doi: 10.1085/jgp.200308863. Epub 2003 Nov 10.

pH changes in the invaginating synaptic cleft mediate feedback from horizontal cells to cone photoreceptors by modulating Ca2+ channels

Affiliations

pH changes in the invaginating synaptic cleft mediate feedback from horizontal cells to cone photoreceptors by modulating Ca2+ channels

Hajime Hirasawa et al. J Gen Physiol. 2003 Dec.

Abstract

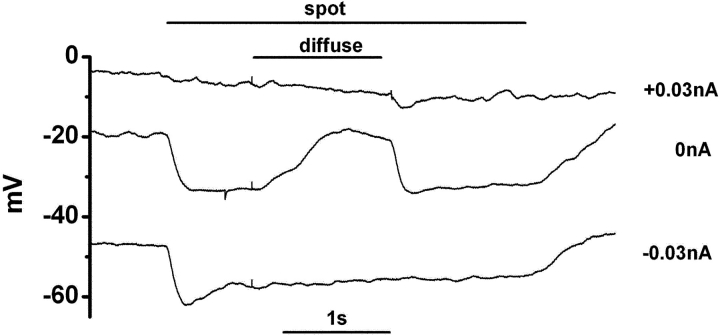
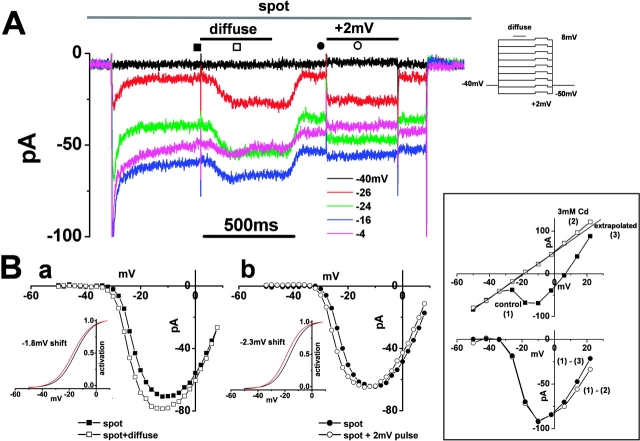
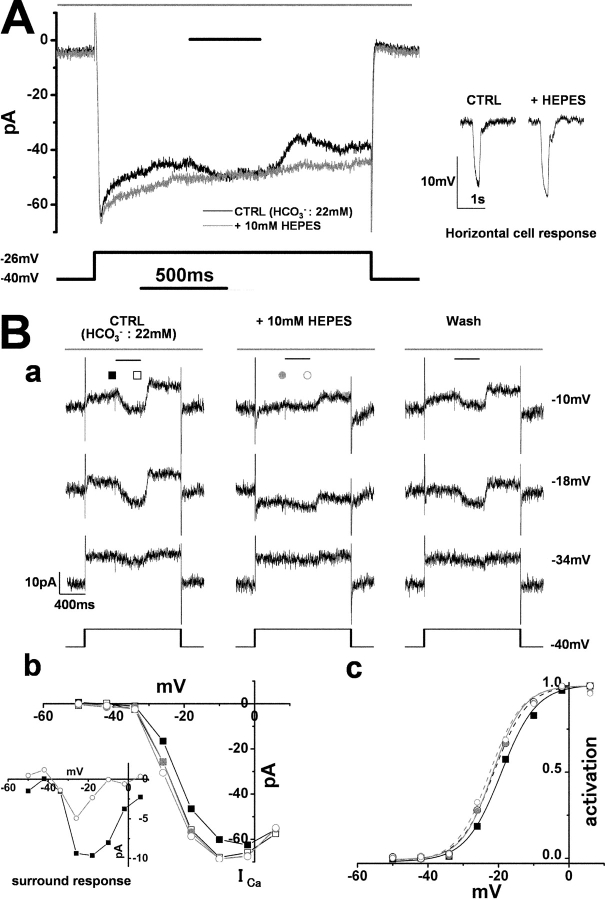
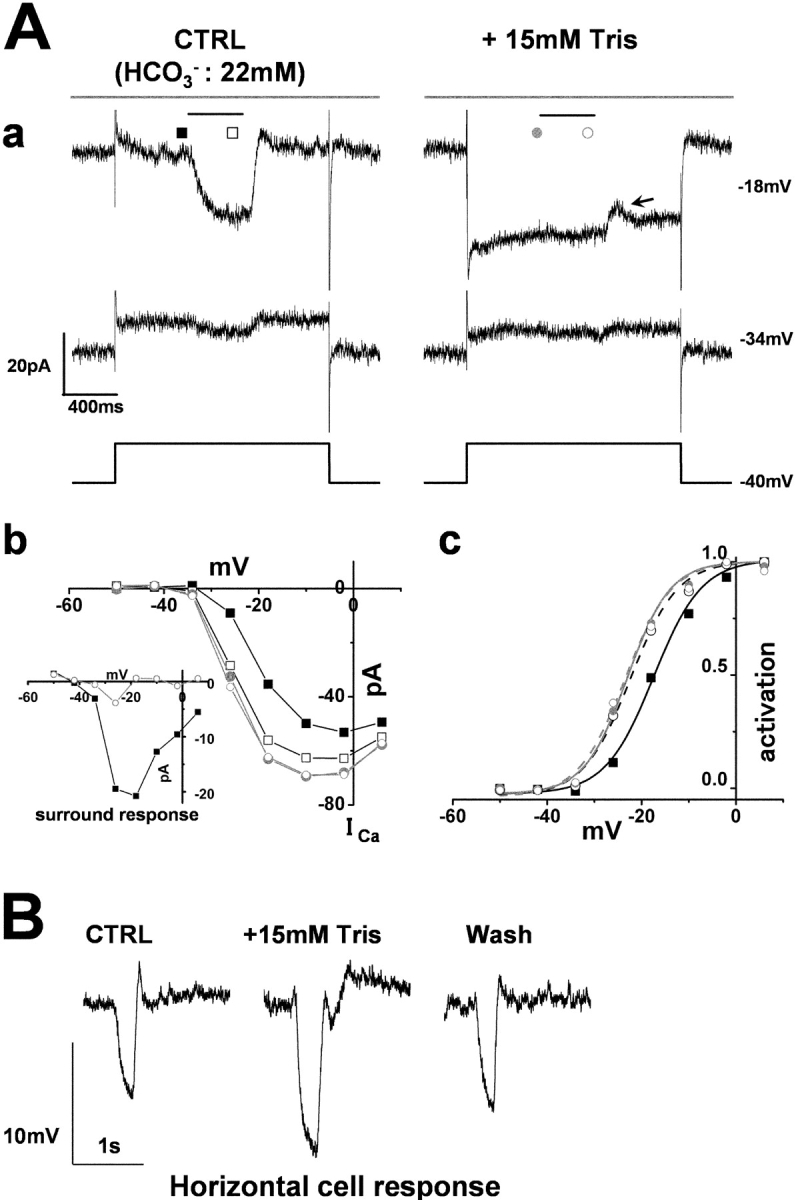
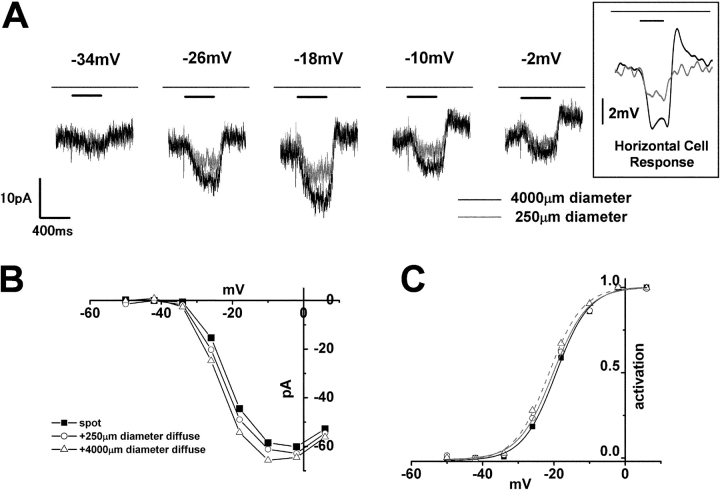
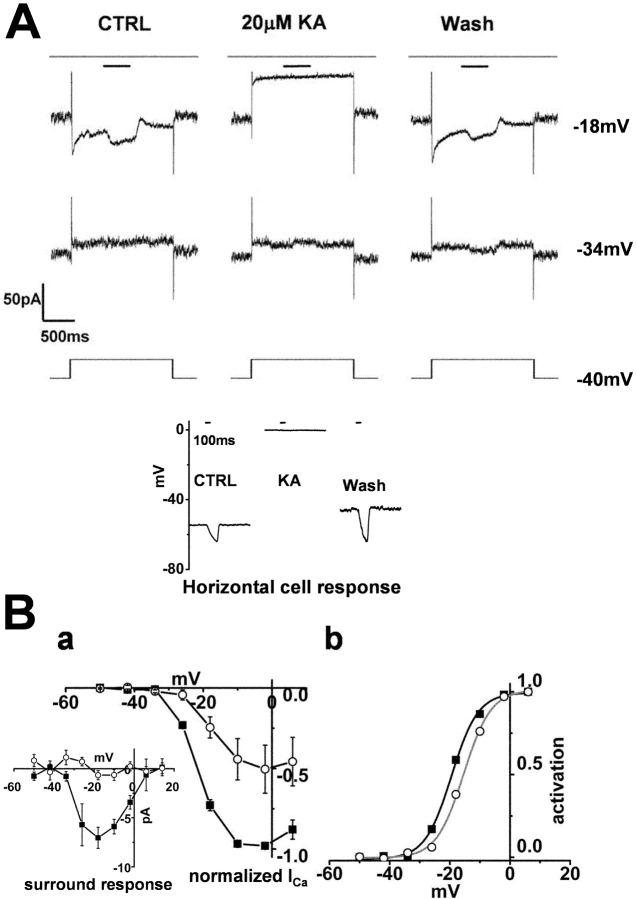
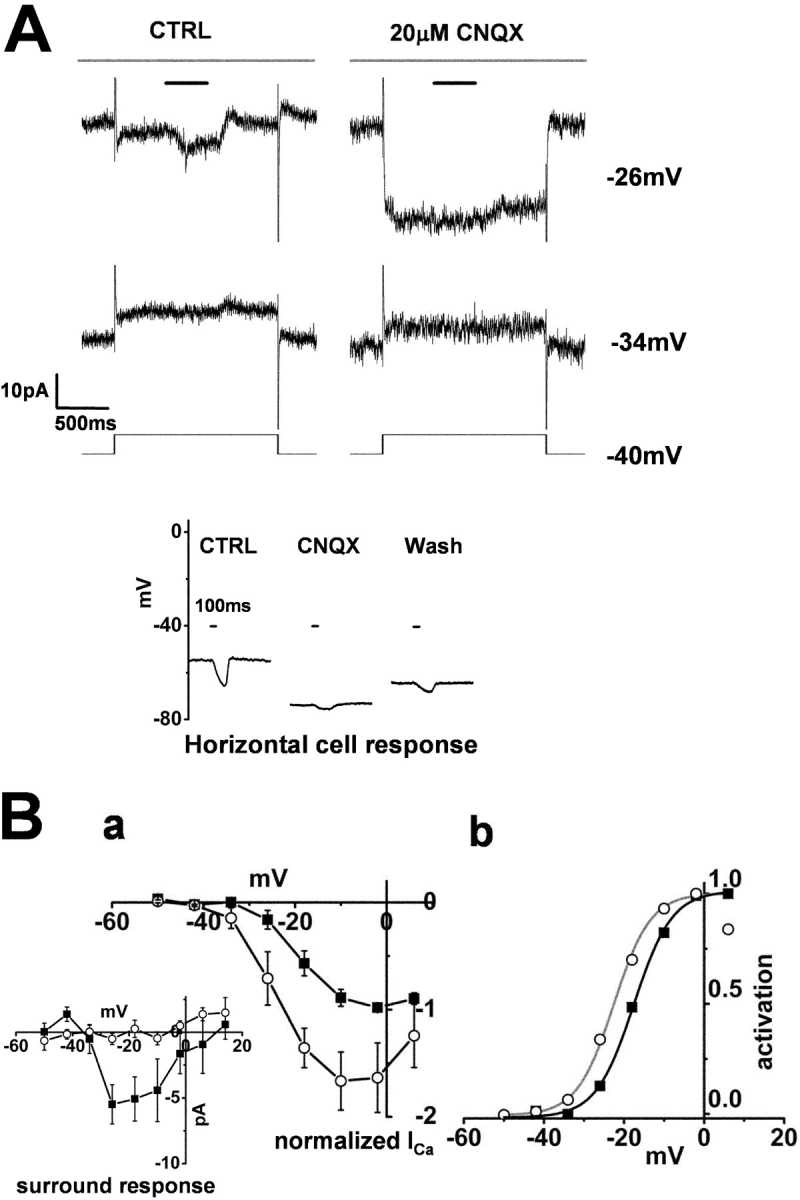
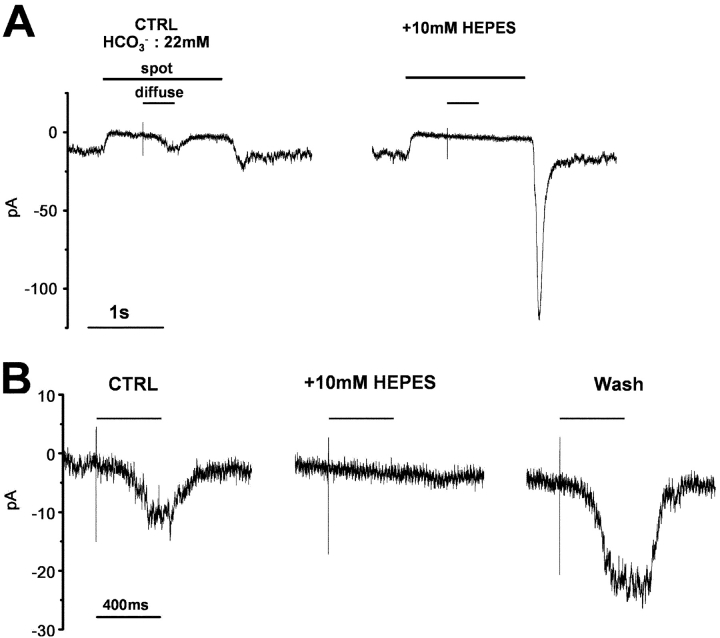
Feedback from horizontal cells (HCs) to cone photoreceptors plays a key role in the center-surround-receptive field organization of retinal neurons. Recordings from cone photoreceptors in newt retinal slices were obtained by the whole-cell patch-clamp technique, using a superfusate containing a GABA antagonist (100 microM picrotoxin). Surround illumination of the receptive field increased the voltage-dependent calcium current (ICa) in the cones, and shifted the activation voltage of ICa to negative voltages. External alkalinization also increased cone ICa and shifted its activation voltage toward negative voltages. Enrichment of the pH buffering capacity of the extracellular solution increased cone ICa, and blocked any additional increase in cone ICa by surround illumination. Hyperpolarization of the HCs by a glutamate receptor antagonist-augmented cone ICa, whereas depolarization of the HCs by kainate suppressed cone ICa. From these results, we propose the hypothesis that pH changes in the synaptic clefts, which are intimately related to the membrane voltage of the HCs, mediate the feedback from the HCs to cone photoreceptors. The feedback mediated by pH changes in the synaptic cleft may serve as an additional mechanism for the center-surround organization of the receptive field in the outer retina.


Figures

F<sc>igure</sc> 1.
Figure 1.
The response of a newt cone photoreceptor recorded in the current-clamp mode The outer segment of the cone was illuminated by a spot (diameter, 30 μm; duration, 3,380 ms; timing indicated by the top horizontal line). A diffuse light (diameter, 4,000 μm; duration, 1,250 ms) was superimposed on the spot as indicated by the shorter horizontal line. The retinal slice was superfused with control Ringer's solution buffered with bicarbonate and containing 100 μM picrotoxin. Under control condition (when no current was injected from the recording pipette: 0 nA), illumination with the spot evoked hyperpolarization, and the surround illumination evoked depolarization in the cone. Both hyperpolarization and depolarization of the cone induced by current injection (−0.03 and +0.03 nA) from the recording pipette abolished the surround response. The vertical scale on the left indicates the absolute membrane voltage. Recovery at the spot offset was slow (1 s), probably due to blockade of the calcium feedback to the phototransduction cascade in the cones (Lamb et al., 1986; Nakatani and Yau, 1988), because the intracellular Ca2+ level was maintained at a low level due to the addition of 20 mM BAPTA in the pipette solution. Lowering the BAPTA concentration in the pipette solution (5 mM) accelerated the recovery (0.5 s; unpublished data).
F<sc>igure</sc> 2.
Figure 2.
Surround illumination augments the cone Ca2+ current A. The Ca2+ current (ICa) in the cone photoreceptors of the newt retinal slice was recorded under the whole-cell voltage clamp condition. The retinal slice was superfused with control Ringer's solution buffered with bicarbonate and containing 100 μM picrotoxin. The cone was held at −40 mV and polarized to voltages ranging from −50 mV to +8 mV in 2-mV steps. Five representative traces, voltage- clamped at −40, −26, −24, −16, and −4 mV, are shown. During the command voltage, surround illumination (diameter, 4,000 μm; duration, 400 ms: shorter bar) was applied every 4 s, while the spot illumination (diameter, 30 μm: top bar) was maintained. An additional 2-mV depolarization was applied to mimic an ephaptic effect (external voltage drop) after withdrawing the surround illumination. Note that at −4 mV (pink trace); surround illumination evoked an inward current, while a +2-mV pulse evoked an outward current. The current amplitude was sampled at the time indicated by the symbols, to construct the I-V curves shown in B a and B b. (B a) Leak-subtracted I-V curve of the cone ICa in the presence of the spot (filled squares) and during surround illumination (open squares). The data are from the same cone as in A. The leakage current amplitude (conductance, 0.59 nS), determined by extrapolation of the linear portion of the I-V curve between −50 and −32 mV, was subtracted from the measured current amplitude at each voltage. Inset shows activation curves fitted to the Boltzmann function derived from the I-V curves. The midpoint of the curve as obtained under the control condition (−15.3 mV; black line) was shifted by 1.8 mV in the negative direction during surround illumination (red line). The maximum conductance was calculated from the slope of the I-V curve between +2 and +8 mV and normalized to 1.0. (b) Leak-subtracted I-V curve of the cone ICa in the presence of the spot light (filled circles) and during a +2-mV depolarizing pulse (open circles). Inset shows activation curves fitted to the Boltzmann function derived from the I-V curves. The midpoint of the curve as obtained under the control condition (−16.2 mV; black line) was shifted by 2.3 mV in the negative direction during the 2-mV induced depolarization (red line). The 0.3 mV discrepancy in the curve shifting is probably due to a curve fitting error or a voltage clamp error. (Boxed inset) Isolation method of I-V relations of cone ICa. These data were obtained from a different cone in A. (Top) The I-V relations of the cone were obtained in the control solution (filled squares (1)) and in a 3-mM Cd-containing solution (open squares (2)). The leakage conductance (2.7 nS) was estimated by extrapolating the linear part of the I-V curve between −50 and −36 mV (solid line (3)). (Bottom, open circles) I-V relations of the cone ICa obtained by subtracting the I-V curve recorded in a 3-mM Cd-containing solution from that recorded in the control solution ((1) − (2)). (filled circles) I-V relations obtained by subtracting the I-V curve from the extrapolated leakage current from that recorded in the control solution ((1) − (3)).
F<sc>igure</sc> 3.
Figure 3.
Modulation of cone ICa by focal application of a high-pH solution to the cone synaptic terminal layer. Recordings were obtained from cone photoreceptors of newt retinal slices under whole-cell voltage clamp. The slices were superfused with control Ringer's solution buffered with bicarbonate and containing 100 μM picrotoxin. (A) Alkalinized Ringer's solution (pH 9.0) was focally applied to the cone synaptic terminal layer by pressure ejection (duration: 10 ms, pressure: 59 kPa; time indicated by arrow). The cell was voltage-clamped at various voltages in the range of −50 to +6 mV, in 8-mV steps. The representative four traces, voltage clamped at −42, −26, −18, and +6 mV are shown. Transient signals at the pressure ejection were artifacts produced by the valve opening. While a small inward current at −42 mV was seen in this cell, it was not seen in the other five cones tested. The current was sampled at the points marked by a symbol to construct the I-V curves shown in B. Small spot (diameter, 30 μm) illumination was maintained throughout. (B, top) Leak-subtracted I-V curve of cone ICa in normal Ringer's solution (pH 7.4, filled squares) and in response to a high-pH solution (pH 9.0, open circles). The data is from the same cell as that described in A. The leak conductance was 0.94 nS. (Bottom) Activation curves derived from the I-V curves fitted to the Boltzmann function. The midpoint of the curve (−17.7 mV; black line connecting the filled squares) as obtained in normal Ringer's solution (pH 7.4) was shifted to −28.1 mV (gray line connecting the open circles) after the application of the high-pH solution. The maximum conductance was calculated from the slope of the I-V curve in the high-pH solution, between −10 and 6 mV, and normalized to 1.0.
F<sc>igure</sc> 4.
Figure 4.
The cone ICa and its surround response recorded in a superfusate enriched with HEPES. A cone photoreceptor in the retinal slice was recorded under whole-cell voltage clamp. The slice was superfused with control Ringer's solution (buffered with bicarbonate) and the solution enriched with HEPES to elevate the pH buffering capacity. (A) Effects of the 10-mM HEPES-enriched buffer on the cone ICa and surround response. The cone photoreceptor was depolarized from the holding voltage of −40 to −26 mV. Diffuse light (duration, 400 ms) illumination was given during the step depolarization (shorter bar) in the presence of a small spot light (diameter, 30 μm; top bar). (Black trace) Current recorded in the control solution (bicarbonate buffer alone). (Gray trace) Current recorded in the external solution with bicarbonate buffer plus 10 mM HEPES. The leakage conductance was 0.53 nS. Inset shows the horizontal cell responses to a large light spot (diameter, 4,000 μm; duration 100 ms), in the control solution and in the solution enriched with HEPES. (B a) Reversible effects of 10-mM HEPES-enriched buffer on the cone ICa and surround response. The small spot light (diameter, 30 μm) was kept on throughout (top bars). Diffuse light (duration, 400 ms) illumination was given during the step depolarization (shorter bar) in the presence of the small spot (diameter, 30 μm; top bar). The cone was held at −40 mV and polarized to voltages ranging from −50 to +6 mV in 8-mV steps. Representative traces, clamped at −34, −18, and −10 mV, are shown. (From the left through the middle to the right column) The current traces before (external HCO3 : 22 mM), during, and after application of bicarbonate solution plus 10 mM HEPES. All the recordings were from the same cell. The recording sequence was left column (−34, −18, and −10 mV) followed by the middle column (the same command voltage sequence as that for the recording in the left column), and finally the right column. The leak conductance of 2.26 nS did not change either in the HEPES-containing solution or during the washout (see, for example the current traces at −34 mV). In the HEPES-containing solution, ICa in darkness was reversibly increased and the surround response was reversibly suppressed (see the current traces at −18 and −10 mV). Symbols denote the sampling points for calculation of the I-V curves of ICa (B b). In the control solution, the inward current produced by ICa was counterbalanced by the outward leak current (at −18 and −10 mV in the control and washout solutions). (b) I-V curves of the cone ICa recorded in B a. The leak conductance was subtracted. Filled squares, in the control solution without surround illumination; open squares, in the control solution during surround illumination; filled gray circles, in the HEPES-containing solution without surround illumination; open gray circles, in the HEPES-containing solution during surround illumination. Inset shows the voltage dependence of the surround response in the control solution (filled squares) and in the HEPES-containing solution (open circles). (c) Activation curves fitted to the Boltzmann function derived from the data in B b. The midpoint of activation curve shifted from −19.2 mV (control, black solid line) to −21.4 mV (surround illumination in control: black broken line), to −21.6 mV (no surround illumination in the HEPES-containing solution, gray solid line), and to −22.5 mV (surround illumination in the HEPES-containing solution, gray broken line). The maximum conductance was determined from the linear part of the curve, between −2 and 6 mV, obtained in the control solution during illumination with diffuse light, and normalized to 1.0.
F<sc>igure</sc> 5.
Figure 5.
The cone ICa and its surround response recorded in a superfusate enriched with Tris A cone photoreceptor in the retinal slice was recorded under whole-cell voltage-clamp. The slice was superfused with control Ringer's solution (buffered with bicarbonate) and a solution enriched with Tris to elevate the pH-buffering capacity. (A a) Effects of 15-mM Tris-enriched buffer (with 15 mM Tris) on the cone ICa and surround response. Diffuse light (duration, 400 ms) illumination was given during the step depolarization (shorter bar) in the presence of a small spot light (diameter, 30 μm; top bar). The cone was held at −40 mV and polarized to voltages ranging from −50 to +6 mV in 8-mV steps. Representative traces at −34 and −18 mV are shown. (From the left to the right column) The current traces before (external HCO3 : 22 mM) and during application of bicarbonate solution plus 15 mM Tris. All the recordings were from the same cell. The recording sequence was: the left column (−34 mV, −18 mV) followed by the right column (the same command voltage sequence as for the recording in the left column). The leak conductance of 2.0 nS did not change in the Tris-containing solution (see, e.g., the current traces at −34 mV). In the Tris-containing solution, the ICa in darkness increased and the surround response was suppressed (see the current traces at −18 mV). Symbols denote the sampling points for the calculation of the I-V curves of ICa (B b). In the control solution, the inward current produced by ICa was counterbalanced by the outward leak current (at −18 mV in control). A current dip appeared toward the time of switch-off of the surround illumination (arrow). (b) I-V curve of the ICa of the same cone photoreceptor shown described in A a. Filled squares, in the control solution without surround illumination; open squares, in the control solution during surround illumination; filled gray circles, in the Tris-containing solution without surround illumination; open gray circles, in the Tris-containing solution during surround illumination. Inset shows the voltage dependence of the surround response in the control solution (filled squares) and in 15 mM Tris-containing solution (open circles). (c) Activation curves fitted to the Boltzmann function derived from the data in A b. (B) Effect of Tris on the response of a HC to the flash of a large (diameter, 4,000 μm; duration, 100 ms) light spot. The recording in the left column was taken in the control Ringer, that in the middle column was recorded during application of 15 mM Tris-containing solution, and the right record that in the right column was recorded after the return of the slice to the control Ringer's solution.
F<sc>igure</sc> 6.
Figure 6.
Effects of the diameter of illumination on the surround response of a cone photoreceptor. (A) Surround response of a cone photoreceptor to small (diameter, 250 μm; gray trace) and large (diameter, 4,000 μm; black trace) surround illumination recorded at various holding voltages (indicated on each trace). Diffuse light (duration, 400 ms) illumination was given during the step depolarization (shorter bar) in the presence of small spot light (diameter, 30 μm; top bar). (Boxed inset) Voltage response of a HC to small (diameter, 250 μm; gray trace) and large (diameter, 4,000 μm; black trace) surround illumination. The voltage trace was low-pass filtered at 20 Hz. Diffuse light illumination was given during the step depolarization (shorter bar) in the presence of small spot light (top bar). (B) I-V curve of the ICa of the cone shown in A. Filled squares, without surround illumination; open circles, during small (diameter, 250 μm) surround illumination; open triangles, during large (diameter, 4,000 μm) surround illumination. The current was measured at its peak. (C) Activation curves fitted to the Boltzmann function derived from the data in B, showing a lateral shift of the mid point from −17.4 mV (no surround illumination, black solid line) to −20.3 mV (small surround illumination, thin line), and −21.5 mV (large surround illumination, broken line). The maximum conductance was determined from the linear part of the data curve, between −2 and 6 mV, obtained following diffuse light illumination in the control solution, and was normalized to 1.0.
F<sc>igure</sc> 7.
Figure 7.
Effect of kainate on the surround response of a cone photoreceptor and on a horizontal cell. Whole-cell recordings from a cone photoreceptor and a horizontal cell in a retinal slice superfused with control Ringer's solution (buffered with bicarbonate alone). (A) Effects of 20 μM kainate on the cone ICa and the surround response. Diffuse light (duration 400 ms) illumination was given during the step depolarization (shorter bar) in the presence of a small spot light (diameter, 30 μm: top bar). The cell was held at −34 and −18 mV from the initial holding voltage of −40 mV. The current traces in the left column were recorded in the control solution, those in the middle column were recorded in solution containing 20 μM kainate, and those in the right column were recorded after washout of kainate. All the recordings were from the same cell. The recording sequence was left column (−34 mV, −18 mV), middle column (the same command voltage sequence as that for the recording in the left column), and finally the right column. The leak conductance was 3.7 nS. (Inset) Effect of kainate on the light-evoked HC voltage response. The recording in the left column was obtained in control Ringer's solution, that in the middle column was obtained after addition of 20 μM kainate, and that in the right column was obtained after washout of kainate. A large (diameter, 4,000 μm; duration 100 ms) light spot was flashed, the timing of which is indicated by the short bar above each column. (B a) I-V curves of ICa of four cones recorded under the same conditions as those described in A and averaged after normalization to each peak. Filled squares, current recorded in the control solution. Open circles, current recorded in the solution containing 20 μM kainate. Error bars indicate the SEM. (Inset) Changes in the ICa induced by surround illumination recorded in the control solution (filled squares) and in the solution containing 20 μM kainate (open circles). Average of four cones. (b) Activation curves fitted to the Boltzmann function derived from B a. Kainate shifted the midpoint of the curve from −19.4 mV (black line) to −15.5 mV (gray line). The maximum conductance was determined from the linear part of the curve, between −2 and 6 mV, obtained after diffuse light illumination in control Ringer's solution, and was normalized to 1.0.
F<sc>igure</sc> 8.
Figure 8.
Effect of CNQX on the surround response of a cone photoreceptor and on a horizontal cell. Whole-cell recordings from a cone photoreceptor and a horizontal cell in a retinal slice superfused with control Ringer's solution (buffered with bicarbonate alone). (A) Effects of 20 μM CNQX on the ICa in a cone photoreceptor and its surround response. Diffuse light (duration, 400 ms) illumination was given during the step depolarization (shorter bar) in the presence of a small spot light (diameter, 30 μm; top bar). The cell was held at −34 and −26 mV from the initial holding voltage of −40 mV. The current traces shown in the left column were recorded in the control solution, and those shown in the right column were recorded in the solution containing 20 μM CNQX. All the recordings were from the same cell. The recording sequence was: left column (−34 mV, −18 mV), right column (the same command voltage sequence as that for the recording shown in the left column). The leak conductance was 1.6 nS. (Inset) Effect of CNQX on the light-evoked HC voltage response. The recording shown in the left column was obtained in control Ringer's solution, that in the middle column was obtained following the addition of 20 μM CNQX, and that in the right column was obtained after washout of the CNQX. A large (diameter, 4,000 μm; duration 100 ms) light spot was flashed, the timing of which is indicated by the short bar above each column. (B a) I-V curves of the ICa of 3 cones recorded under the same conditions as those described in A and averaged after normalization to each peak. Filled squares, current recorded in the control solution. Open circles, current recorded in the solution containing 20 μM CNQX. Error bars indicate the SEM. (Inset) Changes in the ICa induced by surround illumination recorded in the control solution (filled squares) and in the solution containing 20 μM CNQX (Open circles). Average from three cones. (b) Activation curves fitted to the Boltzmann function derived from B a. CNQX shifted the midpoint of the curve from −17.5 mV (black line) to −22.5 mV (gray line). The maximum conductance was determined from the linear part of the curve, between −2 and 6 mV, obtained after diffuse light illumination in control Ringer's solution, and was normalized to 1.0. The data point at +6 mV in CNQX was omitted for curve fitting.
F<sc>igure</sc> 9.
Figure 9.
Center and surround responses of an off-type bipolar cell recorded in a solution enriched with HEPES. (A) The current responses to a spot light (50 μm in diameter, indicated by the long horizontal bar above the response trace, duration 1,560 ms) and to surround illumination (diffuse light, 4,000 μm in diameter, superimposed on the spot light, duration 400 ms) of an off-type bipolar cell recorded under the voltage-clamp conditions (holding voltage, −40 mV). In control Ringer's solution, spot illumination evoked an outward current (suppression of the maintained inward current), while the surround illumination evoked an inward current (enhancement of the maintained inward current). The HEPES (10 mM)-enriched solution enhanced the maintained inward current (from −12 to −14 pA) and abolished the surround response. The transient inward current at the time of switch-off of spot illumination was prominently increased in HEPES buffer. The two traces were obtained from the same cell. (B) The same recordings as those shown in A in an expanded time and amplitude scale. Horizontal bars indicate the timing of the surround illumination.

Comment in

References

    1. Barnes, S., and Q. Bui. 1991. Modulation of calcium-activated chloride current via pH-induced changes of calcium channel properties in cone photoreceptors. J. Neurosci. 11:4015–4023. - PMC - PubMed
    1. Barnes, S. 1994. After transduction: response shaping and control of transmission by ion channels of the photoreceptor inner segments. Neuroscience. 58:447–459. - PubMed
    1. Barnes, S., V. Merchant, and F. Mahmud. 1993. Modulation of transmission gain by protons at the photoreceptor output synapse. Proc. Natl. Acad. Sci. USA. 90:10081–10085. - PMC - PubMed
    1. Baylor, D.A., M.G. Fuortes, and P.M. O'Bryan. 1971. Receptive fields of cones in the retina of the turtle. J. Physiol. 214:265–294. - PMC - PubMed
    1. Bevans, C.G., and A.L. Harris. 1999. Regulation of connexin channels by pH. Direct action of the protonated form of taurine and other aminosulfonates. J. Biol. Chem. 274:3711–3719. - PubMed

Publication types

MeSH terms

Substances