

Novel form of adaptation in mouse retinal rods speeds recovery of phototransduction
- PMID: 14610022
- PMCID: PMC2229593
- DOI: 10.1085/jgp.200308938
Novel form of adaptation in mouse retinal rods speeds recovery of phototransduction
Abstract
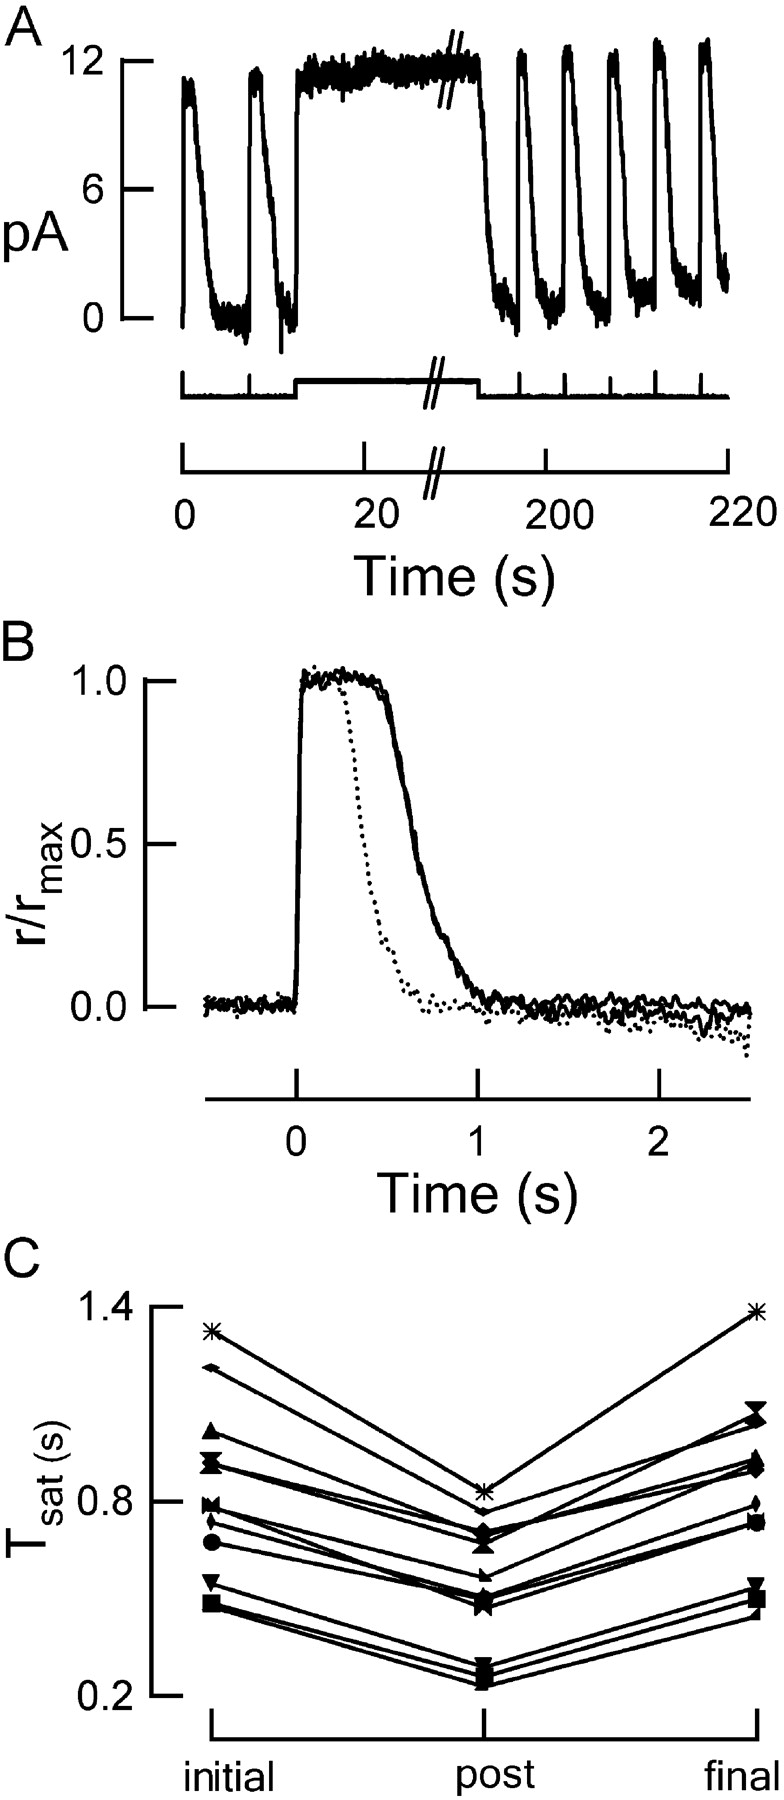
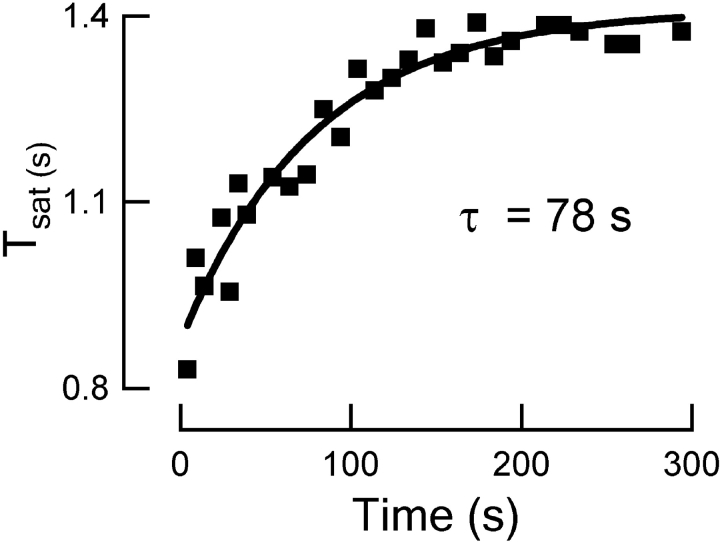
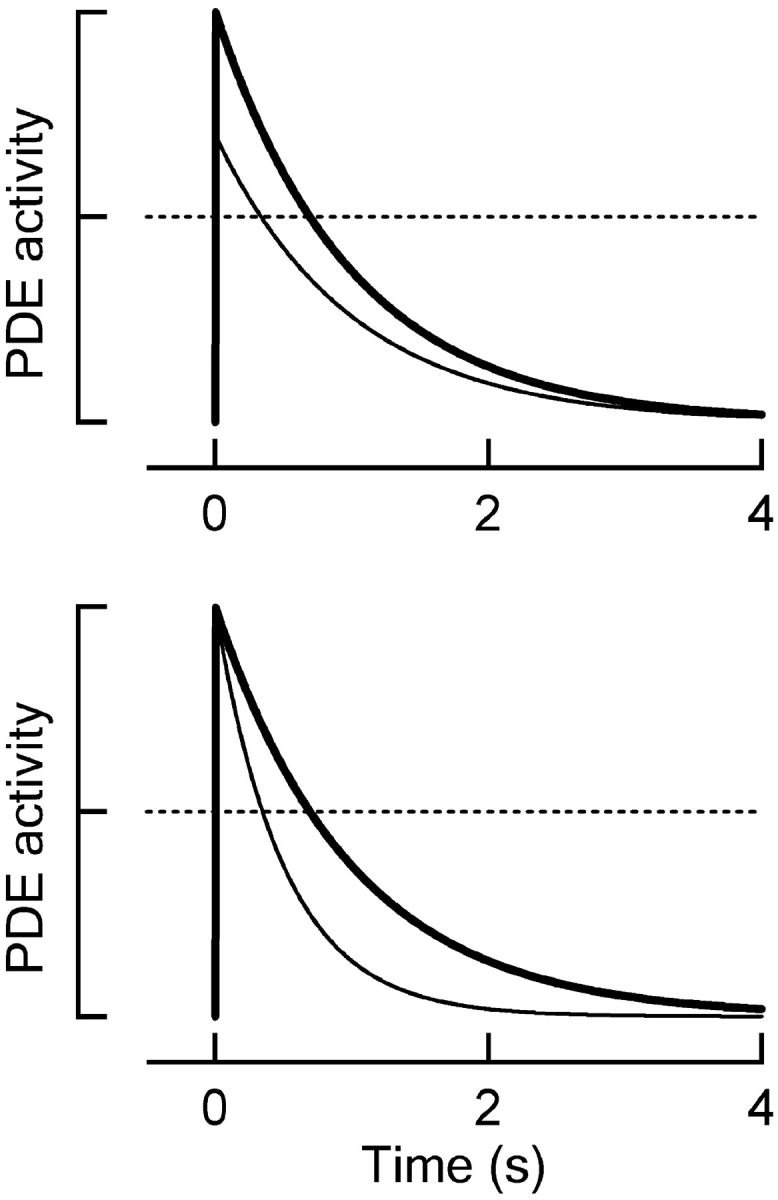
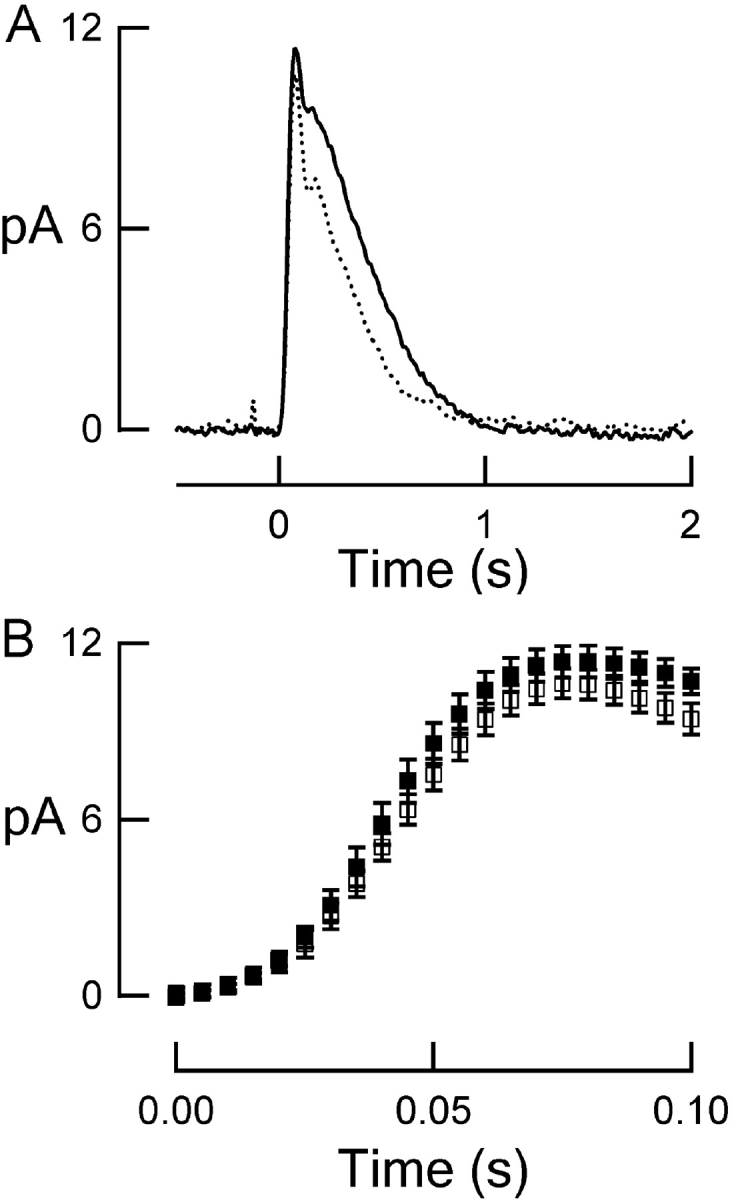
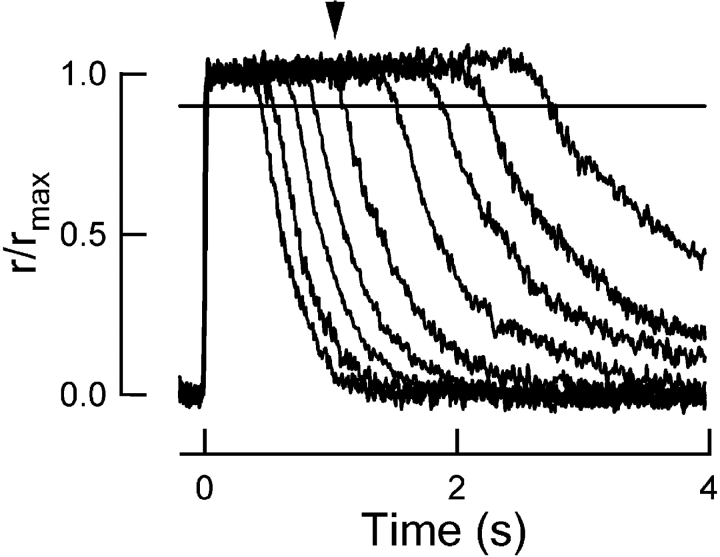
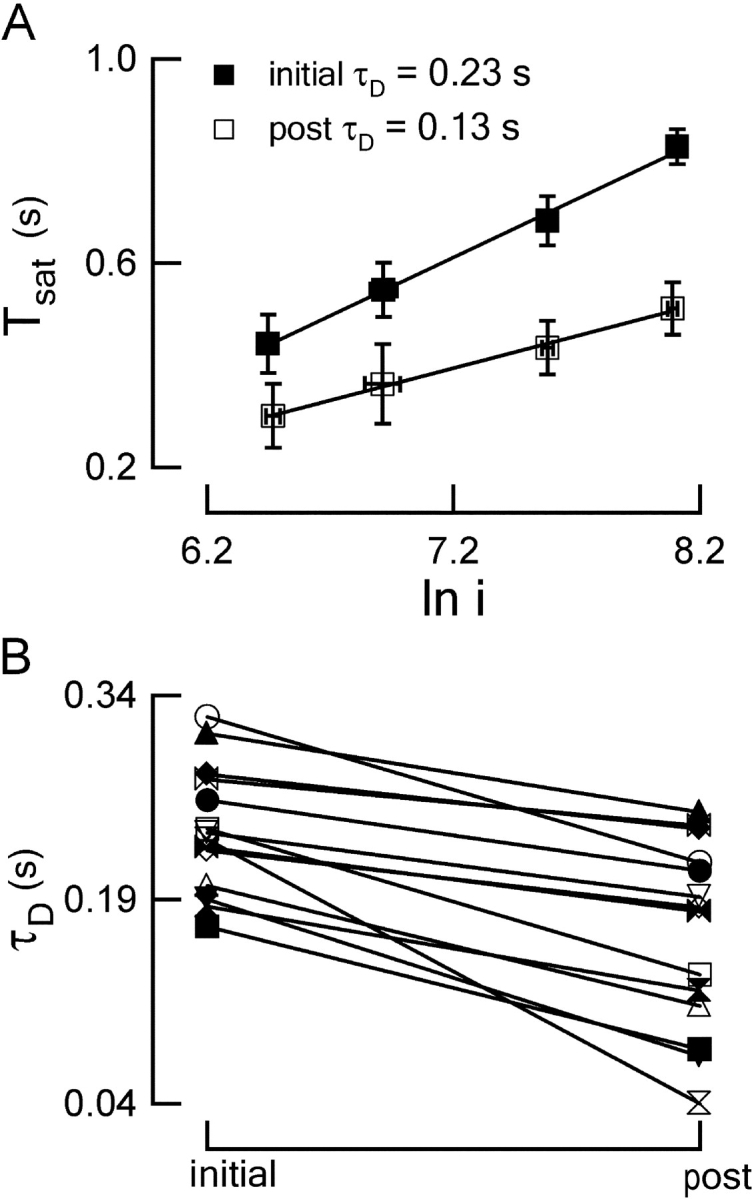
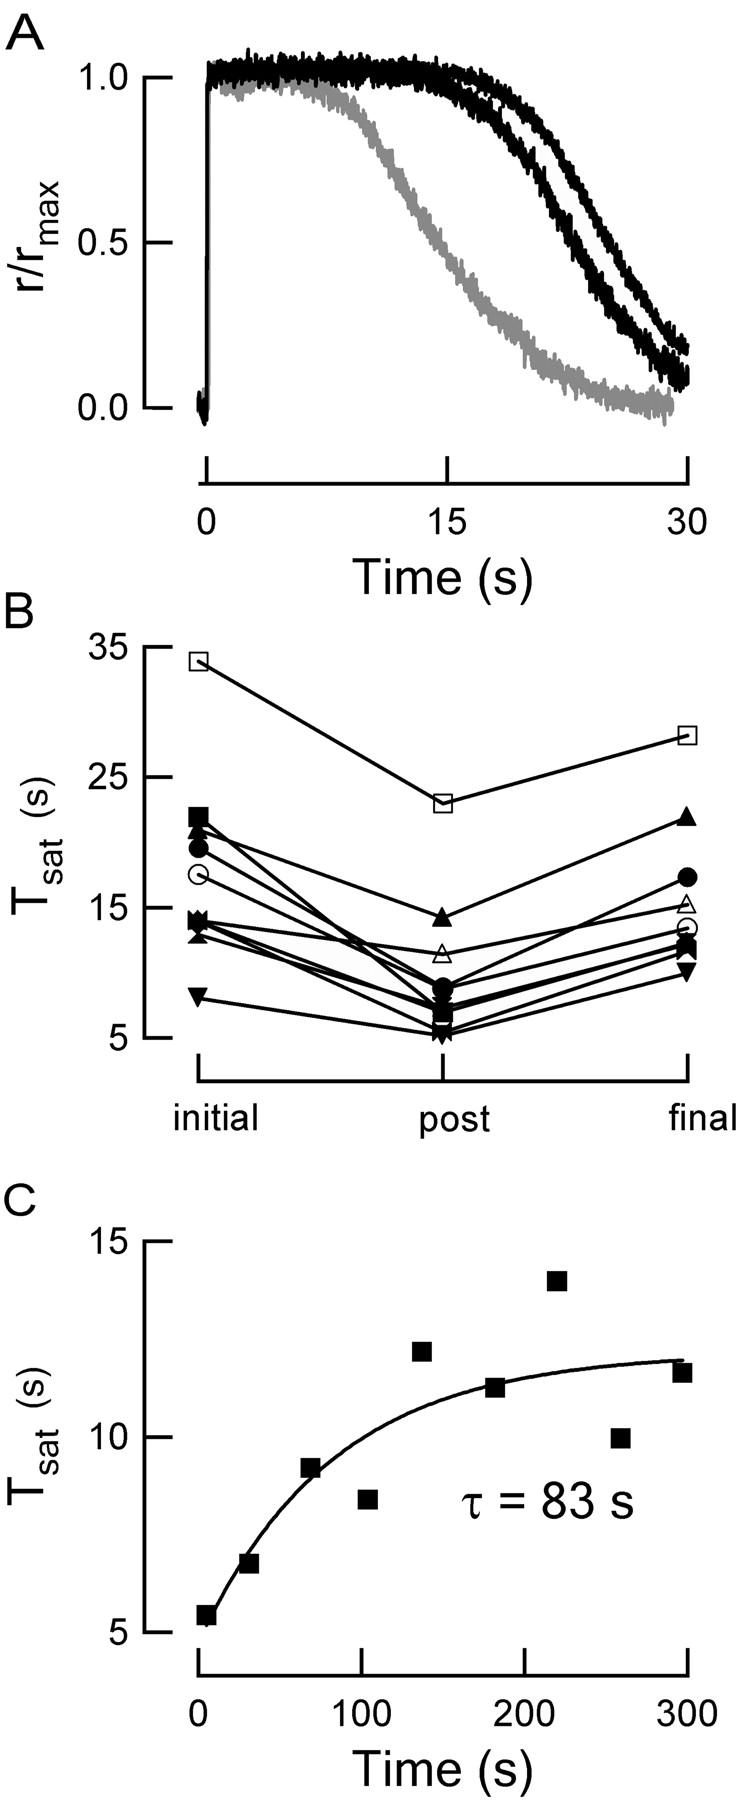
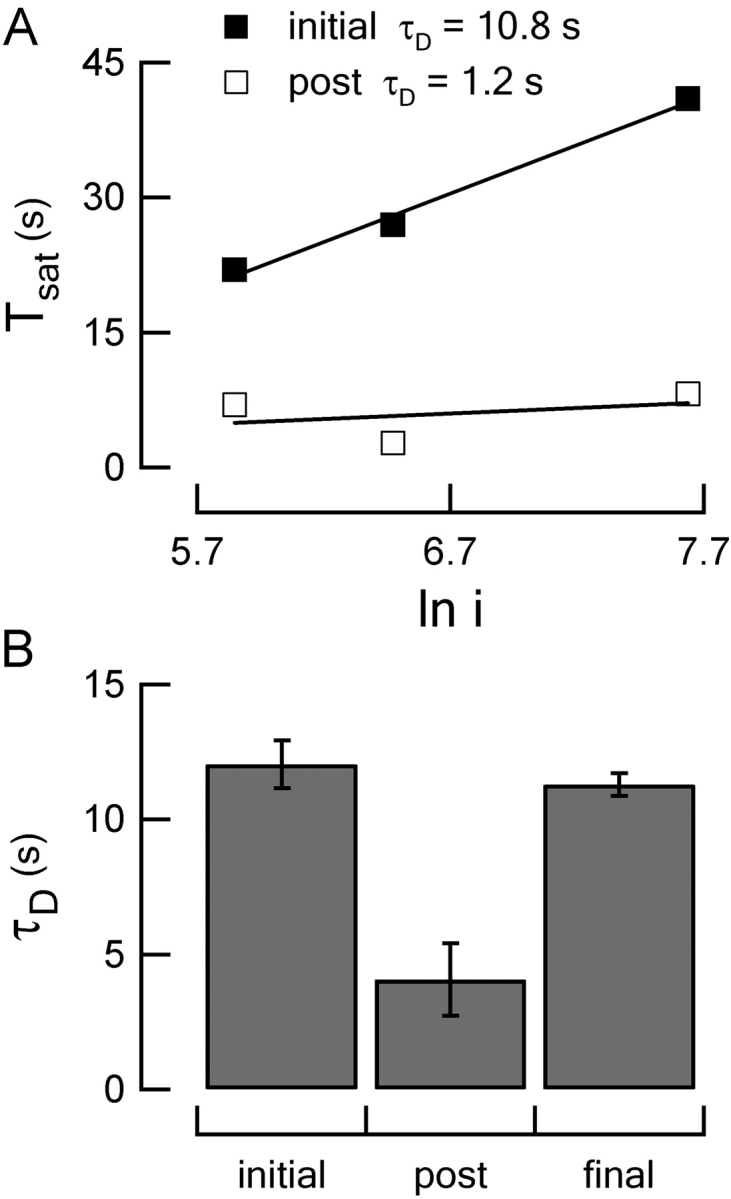
Photoreceptors of the retina adapt to ambient light in a manner that allows them to detect changes in illumination over an enormous range of intensities. We have discovered a novel form of adaptation in mouse rods that persists long after the light has been extinguished and the rod's circulating dark current has returned. Electrophysiological recordings from individual rods showed that the time that a bright flash response remained in saturation was significantly shorter if the rod had been previously exposed to bright light. This persistent adaptation did not decrease the rate of rise of the response and therefore cannot be attributed to a decrease in the gain of transduction. Instead, this adaptation was accompanied by a marked speeding of the recovery of the response, suggesting that the step that rate-limits recovery had been accelerated. Experiments on knockout rods in which the identity of the rate-limiting step is known suggest that this adaptive acceleration results from a speeding of G protein/effector deactivation.
Figures
Similar articles
-
Role of recoverin in rod photoreceptor light adaptation.J Physiol. 2018 Apr 15;596(8):1513-1526. doi: 10.1113/JP275779. Epub 2018 Mar 5. J Physiol. 2018. PMID: 29435986 Free PMC article.
-
Adaptive potentiation in rod photoreceptors after light exposure.J Gen Physiol. 2014 Jun;143(6):733-43. doi: 10.1085/jgp.201411163. Epub 2014 May 12. J Gen Physiol. 2014. PMID: 24821966 Free PMC article.
-
Speeding rod recovery improves temporal resolution in the retina.Vision Res. 2015 May;110(Pt A):57-67. doi: 10.1016/j.visres.2015.02.011. Epub 2015 Mar 5. Vision Res. 2015. PMID: 25748270 Free PMC article.
-
Lessons from photoreceptors: turning off g-protein signaling in living cells.Physiology (Bethesda). 2010 Apr;25(2):72-84. doi: 10.1152/physiol.00001.2010. Physiology (Bethesda). 2010. PMID: 20430952 Free PMC article. Review.
-
Tuning outer segment Ca2+ homeostasis to phototransduction in rods and cones.Adv Exp Med Biol. 2002;514:179-203. doi: 10.1007/978-1-4615-0121-3_11. Adv Exp Med Biol. 2002. PMID: 12596922 Review.
Cited by
-
Kinetics of rhodopsin deactivation and its role in regulating recovery and reproducibility of rod photoresponse.PLoS Comput Biol. 2010 Dec 16;6(12):e1001031. doi: 10.1371/journal.pcbi.1001031. PLoS Comput Biol. 2010. PMID: 21200415 Free PMC article.
-
Local signaling from a retinal prosthetic in a rodent retinitis pigmentosa model in vivo.J Neural Eng. 2014 Aug;11(4):046012. doi: 10.1088/1741-2560/11/4/046012. Epub 2014 Jun 18. J Neural Eng. 2014. PMID: 24940618 Free PMC article.
-
Channel modulation and the mechanism of light adaptation in mouse rods.J Neurosci. 2010 Dec 1;30(48):16232-40. doi: 10.1523/JNEUROSCI.2868-10.2010. J Neurosci. 2010. PMID: 21123569 Free PMC article.
-
Pepperberg plot: Modeling flash response saturation in retinal rods of mouse.Front Mol Neurosci. 2023 Jan 13;15:1054449. doi: 10.3389/fnmol.2022.1054449. eCollection 2022. Front Mol Neurosci. 2023. PMID: 36710929 Free PMC article.
-
Increased visual sensitivity following periods of dim illumination.Invest Ophthalmol Vis Sci. 2015 Feb 19;56(3):1864-71. doi: 10.1167/iovs.14-15958. Invest Ophthalmol Vis Sci. 2015. PMID: 25698701 Free PMC article.
References
-
- Burns, M.E., A. Mendez, J. Chen, and D.A. Baylor. 2002. Dynamics of cyclic GMP synthesis in retinal rods. Neuron. 36:81–91. - PubMed
-
- Calvert, P.D., V.I. Govardovskii, N. Krasnoperova, R.E. Anderson, J. Lem, and C.L. Makino. 2001. Membrane protein diffusion sets the speed of rod phototransduction. Nature. 411:90–94. - PubMed
-
- Chen, C.K., M.E. Burns, W. He, T.G. Wensel, D.A. Baylor, and M.I. Simon. 2000. Slowed recovery of rod photoresponse in mice lacking the GTPase accelerating protein RGS9-1. Nature. 403:557–560. - PubMed
Publication types
MeSH terms
Grants and funding
LinkOut - more resources
Full Text Sources
Molecular Biology Databases
