Morphologically distinct microtubule ends in the mitotic centrosome of Caenorhabditis elegans
- PMID: 14610052
- PMCID: PMC2173630
- DOI: 10.1083/jcb.200304035
Morphologically distinct microtubule ends in the mitotic centrosome of Caenorhabditis elegans
Abstract
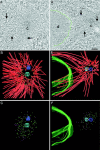
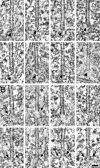
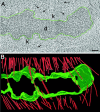
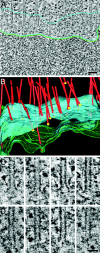
During mitosis, the connections of microtubules (MTs) to centrosomes and kinetochores are dynamic. From in vitro studies, it is known that the dynamic behavior of MTs is related to the structure of their ends, but we know little about the structure of MT ends in spindles. Here, we use high-voltage electron tomography to study the centrosome- and kinetochore-associated ends of spindle MTs in embryonic cells of the nematode, Caenorhabditis elegans. Centrosome-associated MT ends are either closed or open. Closed MT ends are more numerous and are uniformly distributed around the centrosome, but open ends are found preferentially on kinetochore-attached MTs. These results have structural implications for models of MT interactions with centrosomes.
Figures


Similar articles
-
C. elegans chromosomes connect to centrosomes by anchoring into the spindle network.Nat Commun. 2017 May 11;8:15288. doi: 10.1038/ncomms15288. Nat Commun. 2017. PMID: 28492281 Free PMC article.
-
Role of chromosomes in assembly of meiotic and mitotic spindles.Prog Cell Cycle Res. 1997;3:271-84. doi: 10.1007/978-1-4615-5371-7_22. Prog Cell Cycle Res. 1997. PMID: 9552422 Review.
-
Centromere Dysfunction Compromises Mitotic Spindle Pole Integrity.Curr Biol. 2019 Sep 23;29(18):3072-3080.e5. doi: 10.1016/j.cub.2019.07.052. Epub 2019 Sep 5. Curr Biol. 2019. PMID: 31495582
-
The centrosome in vertebrates: more than a microtubule-organizing center.Trends Cell Biol. 2001 Oct;11(10):413-9. doi: 10.1016/s0962-8924(01)02085-2. Trends Cell Biol. 2001. PMID: 11567874 Review.
-
Genetic Control of Kinetochore-Driven Microtubule Growth in Drosophila Mitosis.Cells. 2022 Jul 6;11(14):2127. doi: 10.3390/cells11142127. Cells. 2022. PMID: 35883570 Free PMC article.
Cited by
-
An extended DNA-free intranuclear compartment organizes centrosome microtubules in malaria parasites.Life Sci Alliance. 2021 Sep 17;4(11):e202101199. doi: 10.26508/lsa.202101199. Print 2021 Nov. Life Sci Alliance. 2021. PMID: 34535568 Free PMC article.
-
C. elegans chromosomes connect to centrosomes by anchoring into the spindle network.Nat Commun. 2017 May 11;8:15288. doi: 10.1038/ncomms15288. Nat Commun. 2017. PMID: 28492281 Free PMC article.
-
A cryo-ET survey of microtubules and intracellular compartments in mammalian axons.J Cell Biol. 2022 Feb 7;221(2):e202103154. doi: 10.1083/jcb.202103154. Epub 2021 Dec 8. J Cell Biol. 2022. PMID: 34878519 Free PMC article.
-
A novel chromosome segregation mechanism during female meiosis.Mol Biol Cell. 2016 Aug 15;27(16):2576-89. doi: 10.1091/mbc.E16-05-0331. Epub 2016 Jun 22. Mol Biol Cell. 2016. PMID: 27335123 Free PMC article.
-
Transient structure associated with the spindle pole body directs meiotic microtubule reorganization in S. pombe.Curr Biol. 2012 Apr 10;22(7):562-74. doi: 10.1016/j.cub.2012.02.042. Epub 2012 Mar 15. Curr Biol. 2012. PMID: 22425159 Free PMC article.
References
-
- Albertson, D.G. 1984. Formation of the first cleavage spindle in nematode embryos. Dev. Biol. 101:61–72. - PubMed
-
- Bornens, M. 2002. Centrosome composition and microtubule anchoring mechanisms. Curr. Opin. Cell Biol. 14:25–34. - PubMed
-
- Bullitt, E., M.P. Rout, J.V. Kilmartin, and C.W. Akey. 1997. The yeast spindle pole body is assembled around a central crystal of Spc42p. Cell. 89:1077–1086. - PubMed
-
- Byers, B., K. Shriver, and L. Goetsch. 1978. The role of spindle pole bodies and modified microtubule ends in the initiation of microtubule assembly in Sacharomyces cerevisiae. J. Cell Sci. 30:331–352. - PubMed
Publication types
MeSH terms
Substances
Grants and funding
LinkOut - more resources
Full Text Sources
Other Literature Sources

