. 2003 Nov 10;163(3):559-70.
doi: 10.1083/jcb.200302157.

Rab27A and its effector MyRIP link secretory granules to F-actin and control their motion towards release sites

Affiliations

Rab27A and its effector MyRIP link secretory granules to F-actin and control their motion towards release sites

Claire Desnos et al. J Cell Biol. .

Abstract

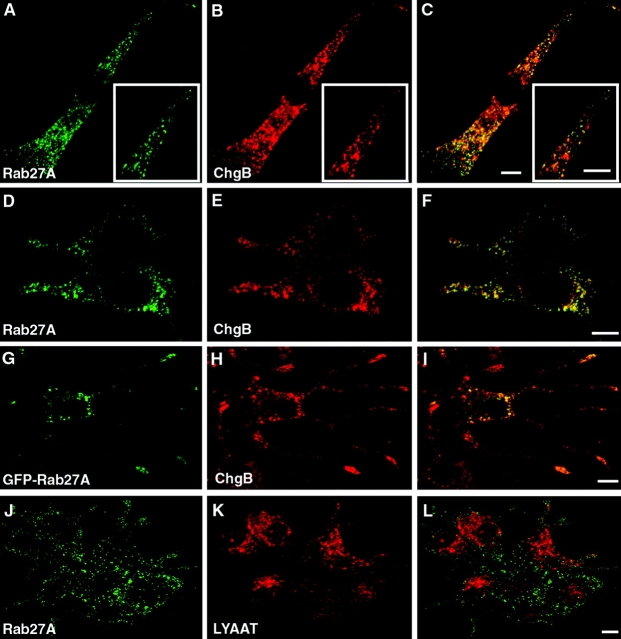
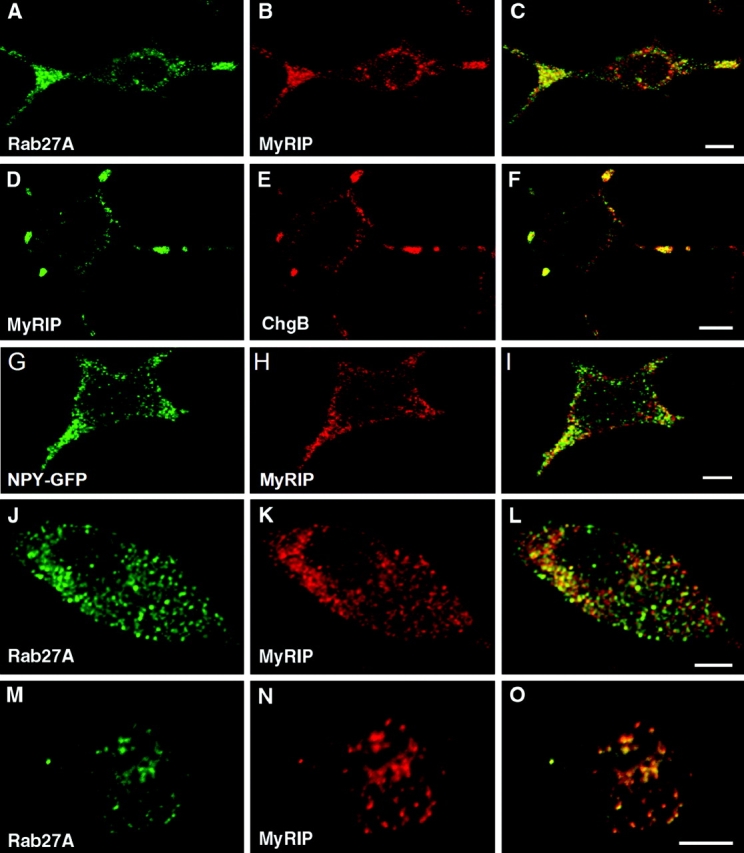
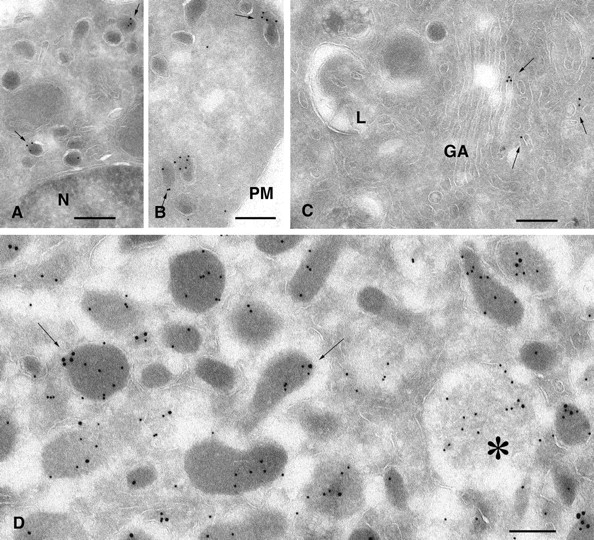
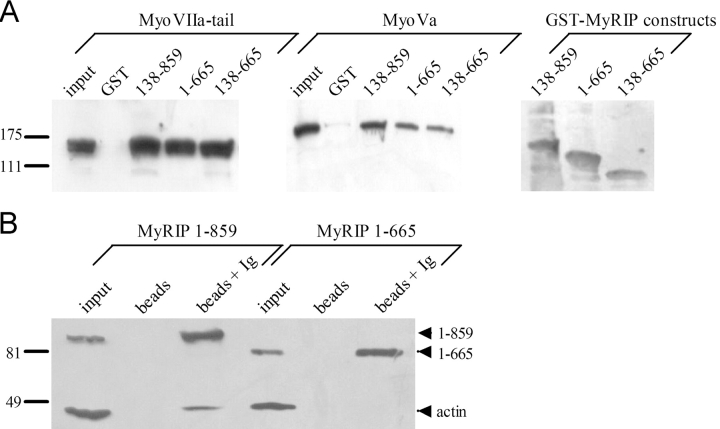
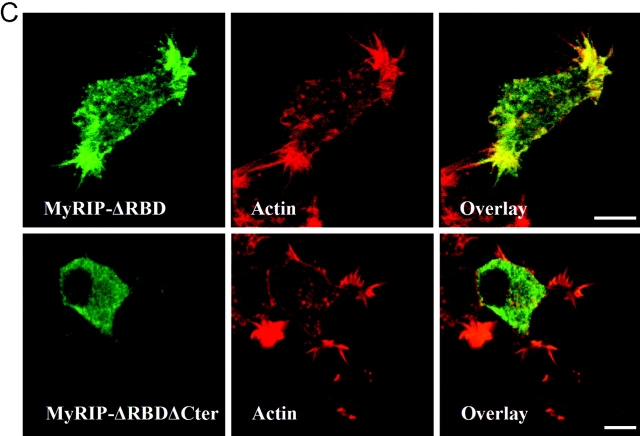
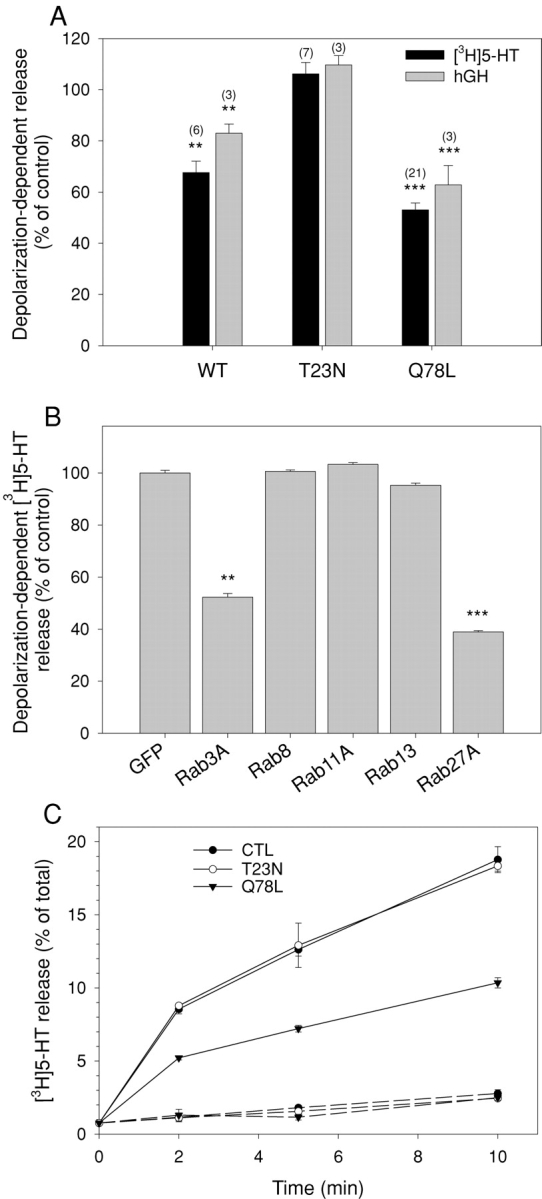
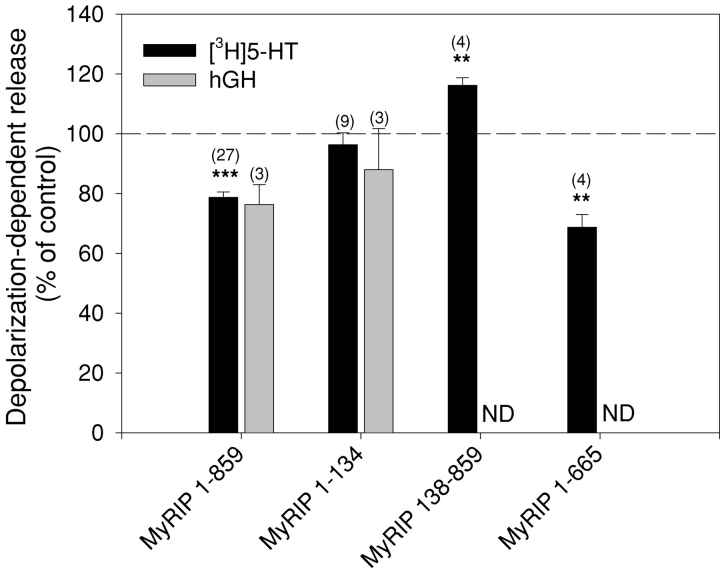
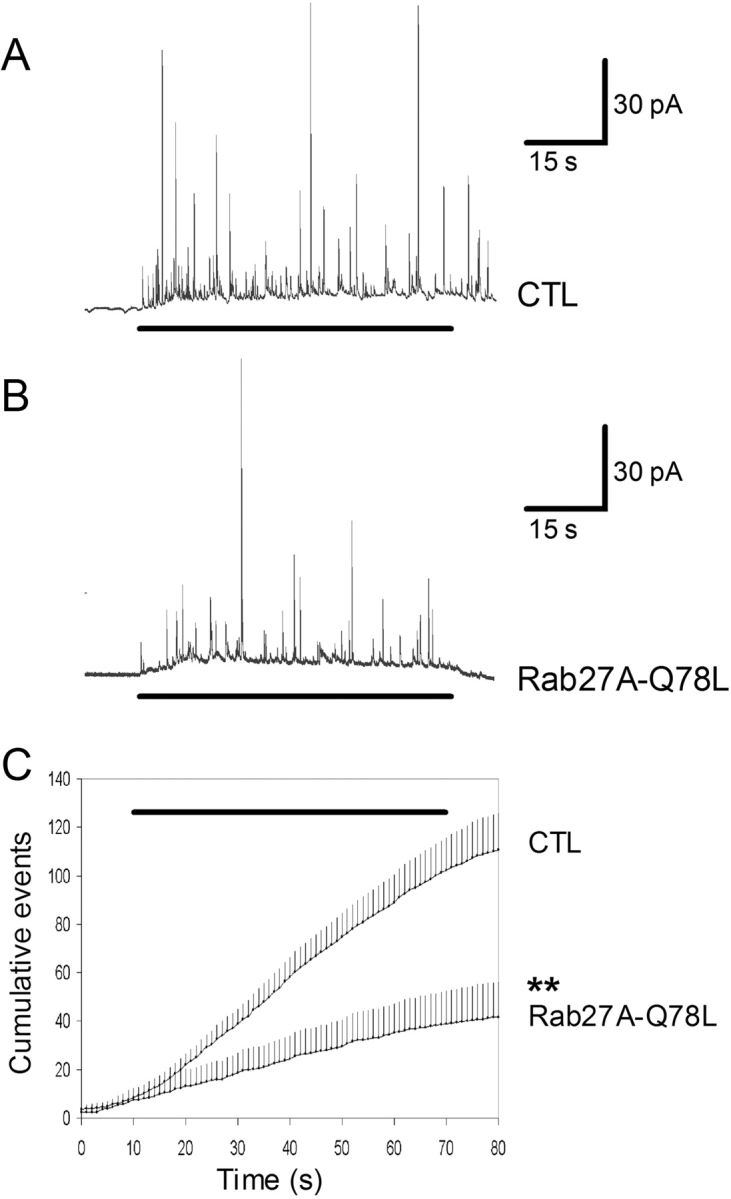
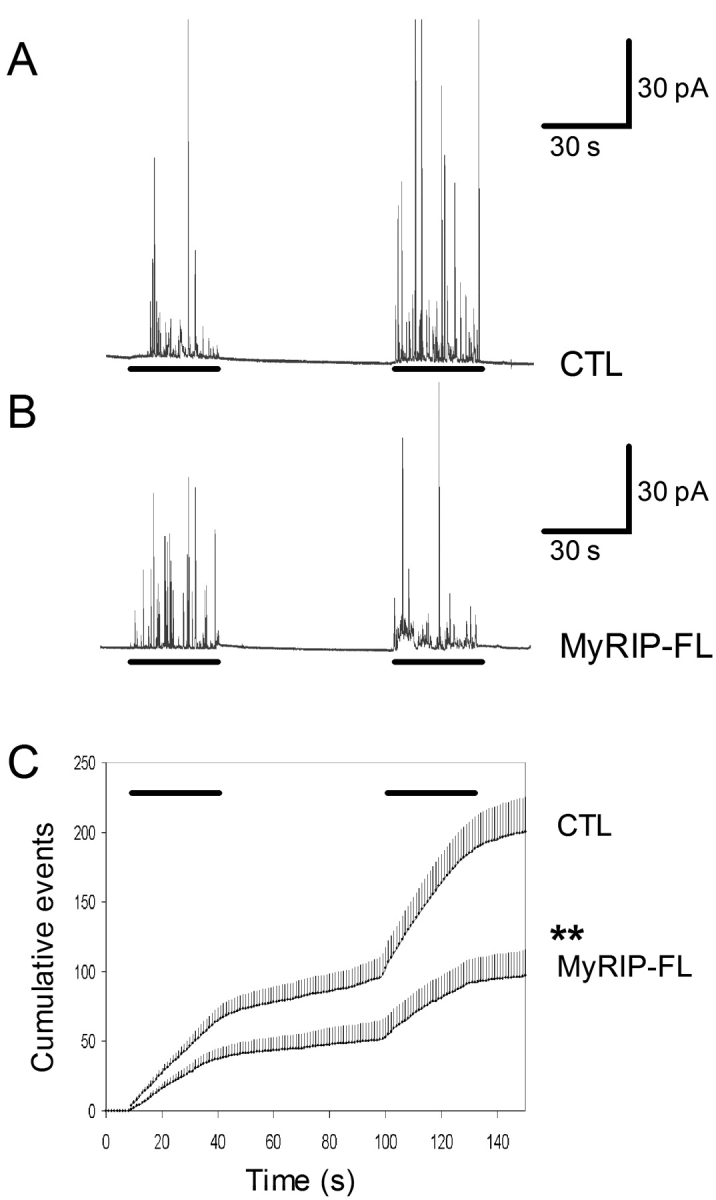
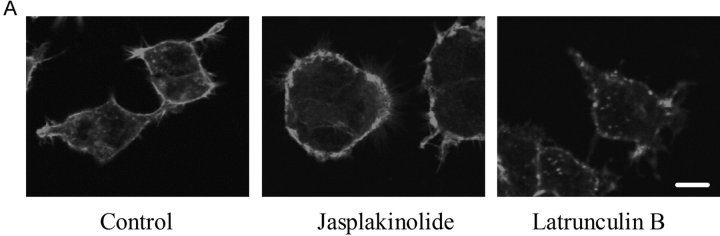
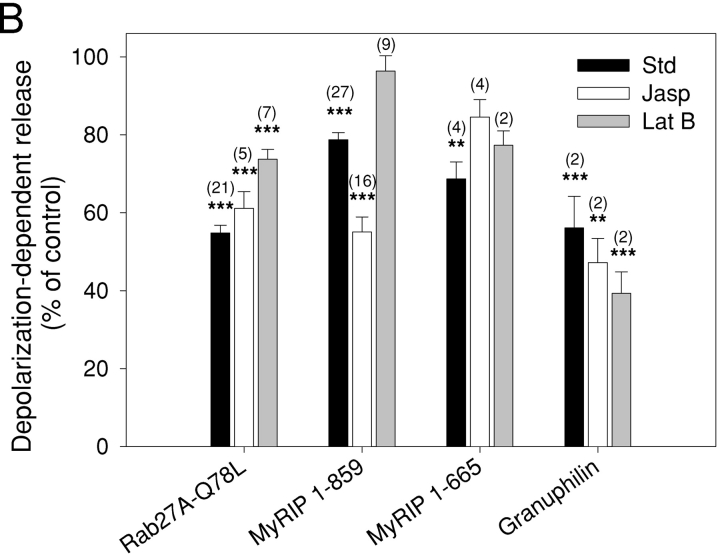
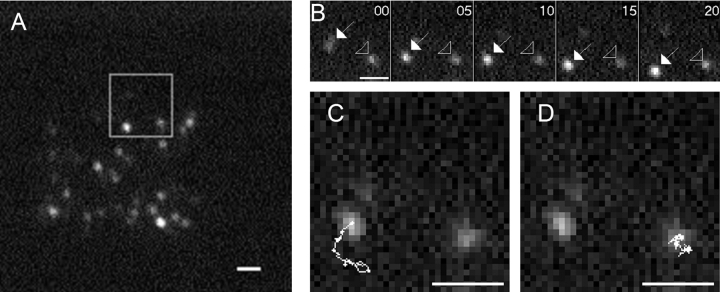
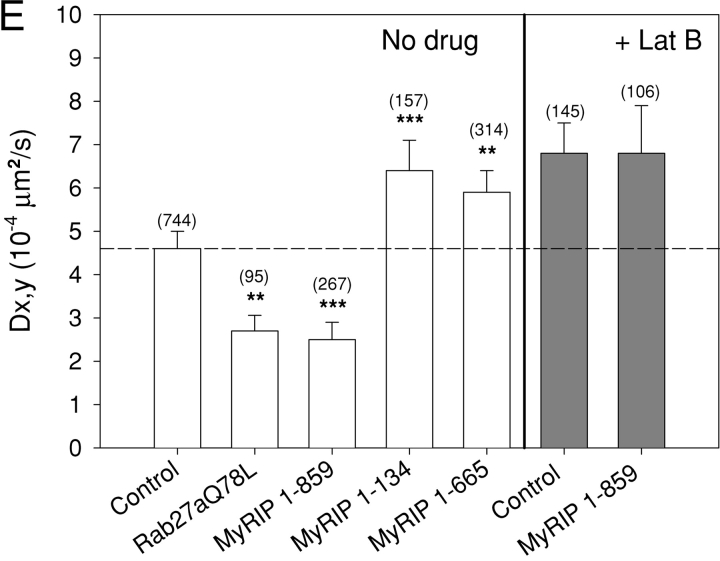
The GTPase Rab27A interacts with myosin-VIIa and myosin-Va via MyRIP or melanophilin and mediates melanosome binding to actin. Here we show that Rab27A and MyRIP are associated with secretory granules (SGs) in adrenal chromaffin cells and PC12 cells. Overexpression of Rab27A, GTPase-deficient Rab27A-Q78L, or MyRIP reduced secretory responses of PC12 cells. Amperometric recordings of single adrenal chromaffin cells revealed that Rab27A-Q78L and MyRIP reduced the sustained component of release. Moreover, these effects on secretion were partly suppressed by the actin-depolymerizing drug latrunculin but strengthened by jasplakinolide, which stabilizes the actin cortex. Finally, MyRIP and Rab27A-Q78L restricted the motion of SGs in the subplasmalemmal region of PC12 cells, as measured by evanescent-wave fluorescence microscopy. In contrast, the Rab27A-binding domain of MyRIP and a MyRIP construct that interacts with myosin-Va but not with actin increased the mobility of SGs. We propose that Rab27A and MyRIP link SGs to F-actin and control their motion toward release sites through the actin cortex.


Figures

Figure 1.
Figure 1.
Localization of Rab27A on SGs by confocal immunofluorescence. Chromaffin cells (A–C) were double imaged for endogenous Rab27A (A) and chromogranin A/B (B). Discrete punctate structures were observed in A and B; most of them precisely coincided. See the overlaid image (C) and the detail shown at higher magnification (inset). Anti-Rab27A (D) and anti–chromogranin A/B (E) also stained discrete structures that coincided (F, overlay) in PC12 cells. GFP–Rab27A (G) transiently expressed in NGF-treated PC12 cells also colocalized with chromogranin B–positive structures (H) (I, overlaid image). Note the enrichment of Rab27A and chromogranin B at the tip of neurites. In contrast, Rab27A (J) did not colocalize with LYAAT, a lysosomal marker (K and L). Bars, 5 μm.
Figure 2.
Figure 2.
Confocal immunofluorescence localization of MyRIP on SGs. PC12 cells (A–I) were double imaged for endogenous Rab27A (A) and MyRIP (B) showing discrete punctate structures; most of these structures coincided (C, overlaid image), especially in the neurites. PC12 cells were transfected with pCMV-MyRIP and double imaged for MyRIP (D and H) and chromogranin B (E) or NPY–GFP (G); overlaid images indicate that MyRIP colocalized partly with chromogranin B (F) and NPY–GFP (I). Chromaffin cells (J–O) were imaged for endogenous Rab27A (J and M) and MyRIP (K and N). Many structures were double labeled, as indicated by the overlaid image of a cell sectioned close to the apex (O). Bars, 5 μm.
Figure 3.
Figure 3.
Ultrastructural localization of Rab27A in PC12 and chromaffin cells. Ultrathin cryosections of PC12 (A–C) and chromaffin cells (D) were single or double immunogold labeled for Rab27A (10-nm gold particles, A–C) or Rab27A (15-nm gold particles, D) and chromogranin A/B (10-nm gold particles, D). (A and B) Specific labeling of dense core granules of PC12 cells with anti-Rab27A antibodies. A restricted number of dense granules show high density of labeling for Rab27A (arrows), whereas others are negative. (C) Rab27A-positive tubulo-vesicular structures (arrows) are often observed in the Golgi region. (D) In chromaffin cells, Rab27A localizes to chromogranin-positive SGs (arrows) and to immature granules (star). N, nucleus; PM, plasma membrane; GA, Golgi apparatus. Bars, 200 nm.
Figure 4.
Figure 4.
Interaction of MyRIP with myosin-Va and actin. (A) Binding of myosin-VIIa tail (left) or myosin-Va (middle) to purified GST or GST–MyRIP constructs immobilized on glutathione–Sepharose beads. Transfected COS-7 cells and nontransfected PC12 cells were used as a source of myosin-VIIa and myosin-Va, respectively. Cellular levels of myosin-VIIa and myosin-Va are shown in the first lane of each panel (input, 10% of the volume used in the experiment). The position of molecular weight markers is shown on the left side (×10−3). The same blots were stripped and reprobed with an anti-GST monoclonal antibody to reveal the MyRIP constructs bound to the beads (right). Note that deletion of the COOH-terminal region of MyRIP had little effect on the interaction with myosins. Similar results were obtained in another experiment. (B) The COOH-terminal region of MyRIP is required for actin binding. COS-7 cells were transfected with vectors encoding full-length MyRIP (1–859) or a deletion mutant (1–665). The proteins expressed were immunoprecipitated with anti-MyRIP antibody–conjugated protein A–Sepharose (beads + Ig). Coimmunoprecipitated actin was revealed with a monoclonal antibody. Beads without antibody were used as control (beads). The amount of expressed MyRIP proteins used in the immunoprecipitation is shown on the left (input, 1/8 of the volume used). Similar results were obtained in another experiment. (C) Importance of the COOH-terminal region of MyRIP for its colocalization with F-actin. PC12 cells were transfected with MyRIP-ΔRBD (138–859) (top) or MyRIP-ΔRBD-ΔCter (138–665) (bottom). 3 d later, cells were stained with anti–myc tag antibodies (left) or rhodamine-phalloidin (middle) and imaged by confocal immunofluorescence. The overlaid images (right) show that MyRIP-ΔRBD, but not MyRIP-ΔRBD-ΔCter, colocalizes with F-actin.
Figure 4.
Figure 4.
Interaction of MyRIP with myosin-Va and actin. (A) Binding of myosin-VIIa tail (left) or myosin-Va (middle) to purified GST or GST–MyRIP constructs immobilized on glutathione–Sepharose beads. Transfected COS-7 cells and nontransfected PC12 cells were used as a source of myosin-VIIa and myosin-Va, respectively. Cellular levels of myosin-VIIa and myosin-Va are shown in the first lane of each panel (input, 10% of the volume used in the experiment). The position of molecular weight markers is shown on the left side (×10−3). The same blots were stripped and reprobed with an anti-GST monoclonal antibody to reveal the MyRIP constructs bound to the beads (right). Note that deletion of the COOH-terminal region of MyRIP had little effect on the interaction with myosins. Similar results were obtained in another experiment. (B) The COOH-terminal region of MyRIP is required for actin binding. COS-7 cells were transfected with vectors encoding full-length MyRIP (1–859) or a deletion mutant (1–665). The proteins expressed were immunoprecipitated with anti-MyRIP antibody–conjugated protein A–Sepharose (beads + Ig). Coimmunoprecipitated actin was revealed with a monoclonal antibody. Beads without antibody were used as control (beads). The amount of expressed MyRIP proteins used in the immunoprecipitation is shown on the left (input, 1/8 of the volume used). Similar results were obtained in another experiment. (C) Importance of the COOH-terminal region of MyRIP for its colocalization with F-actin. PC12 cells were transfected with MyRIP-ΔRBD (138–859) (top) or MyRIP-ΔRBD-ΔCter (138–665) (bottom). 3 d later, cells were stained with anti–myc tag antibodies (left) or rhodamine-phalloidin (middle) and imaged by confocal immunofluorescence. The overlaid images (right) show that MyRIP-ΔRBD, but not MyRIP-ΔRBD-ΔCter, colocalizes with F-actin.
Figure 5.
Figure 5.
Rab27A controls the magnitude of secretory responses. (A) SERT-transfected (black bars) or hGH-transfected PC12 cells (gray bars) were cotransfected with vectors encoding untagged Rab27A wild type, Rab27A-T23N, or Rab27A-Q78L, as indicated. Cells were incubated for 10 min in normal or high K+ saline. Release in normal saline medium (2–5% of cellular [3H]5-HT) was subtracted. Results are shown as percentage of the responses of mock-transfected cells. Numbers in brackets refer to the number of independent experiments. The stimulus-dependent release of control cells ranged from 15 to 30% of cellular [3H]5-HT (mean ≈ 20%). (B) Effect of GTPase-deficient Rab3A, Rab8, Rab11, and Rab13 on secretory responses measured as in A. Rab8, Rab11, Rab13, and Rab27A were fused to GFP. Transfection of GFP was used as a control. Results are shown as percentage of the depolarization-dependent [3H]5-HT release from control cells (mean ± SEM, n = 3 independent experiments). Whereas Rab3A-Q81L and GFP–Rab27A-Q78L inhibit PC12 cell stimulated exocytosis, no effect was observed upon overexpression of GFP-tagged GTPase-deficient Rab8, Rab11, or Rab13. (C) [3H]5-HT release as a function of time from control cells (•) or from cells expressing Rab27A-T23N (○) or Rab27A-Q78L (▾). Cells were incubated in normal (dotted line) or high K+ saline (plain line). Results are expressed in percentage (mean ± SEM, n = 3) of total [3H]5-HT present in the cells before stimulation. Similar results were obtained in two other independent experiments.
Figure 6.
Figure 6.
MyRIP controls the magnitude of secretory responses. SERT-transfected (black bars) or hGH-transfected PC12 cells (gray bars) were cotransfected with vectors encoding wild-type MyRIP (MyRIP 1–859), the Rab27A binding domain of MyRIP (MyRIP 1–134), a construct lacking the RBD (138–859), or MyRIP-ΔCter (1–665). Cells were incubated for 10 min in normal or high K+ saline. Release in normal saline medium was subtracted. Results are shown as percentage of the response of mock-transfected cells (mean ± SEM). The number of experiments performed is shown above the bars.
Figure 7.
Figure 7.
Rab27A-Q78L reduces the frequency of amperometric spikes in chromaffin cells. Secretory responses of single adrenal chromaffin cells were monitored by carbon fiber amperometry. (A) Amperometric trace recorded from a GFP-transfected (CTL) chromaffin cell stimulated by local application of 10 μM nicotine (indicated by the bar below the trace). (B) Secretory response of a Rab27A-Q78L–expressing cell. (C) The cumulative number of spikes is plotted against time. Shown are the mean values (+SEM) from 17 cells (CTL) and 6 cells (Rab27A-Q78L). The bar above the traces indicates the presence of nicotine. The significance of difference was calculated with Mann-Whitney test.
Figure 8.
Figure 8.
Overexpression of MyRIP reduces the frequency of amperometric spikes in chromaffin cells. Secretory responses of single adrenal chromaffin cells were monitored by carbon fiber amperometry. (A) Amperometric trace recorded from a GFP-transfected (CTL) chromaffin cell stimulated by local application of high K+ (55 mM) saline (indicated by bars below the trace). (B) Secretory responses of a wild-type MyRIP (MyRIP-FL)–transfected cell. (C) The cumulative number of spikes is plotted against time. Shown are the mean values (+SEM) from 18 cells (CTL) and 16 cells (MyRIP-FL). The bars indicate the application of high K+. The significance of difference was calculated with Mann-Whitney test.
Figure 9.
Figure 9.
The effects of Rab27A-Q78L and MyRIP on secretion depend on the state of the actin cortex. (A) Rhodamine-phalloidin staining of the actin cortex of PC12 cells. Compared with control conditions (left), the thickness of actin is reduced upon latrunculin B treatment (middle) and increased by jasplakinolide (right). (B) The secretory activity of PC12 cells transfected with vectors encoding GFP (as control), Rab27A-Q78L, wild-type MyRIP (MyRIP 1–859), MyRIP-ΔCter (1–665), or granuphilin was measured as in Fig. 5 by means of the [3H]5-HT release assay. Cells were incubated without addition of drug (Std, black bars) or in the presence of 1 μM jasplakinolide (Jasp, open bars) or 5 μM latrunculin B (Lat B, gray bars) for 20 min before and during stimulation of secretion. The effect of the different proteins on secretion was expressed, after subtracting the basal release of [3H]5-HT in normal saline, as percentage of the stimulus-dependent secretory response of GFP-transfected cells measured under the same conditions (i.e., in the absence of drug, in the presence of jasp, or in the presence of lat B). Shown are the results (mean ± SEM) of several independent experiments (the number of experiments is shown above the bars). Latrunculin B significantly reduced (P < 0.001) the inhibitory effects of Rab27A-Q78L and MyRIP on secretion, whereas jasplakinolide increased that of MyRIP (P < 0.001). The net release of GFP-transfected cells was 19 ± 2% of cellular [3H]5-HT in the absence of drug, 20 ± 2.2% in the presence of jasplakinolide, and 31 ± 3% in the presence of latrunculin B.
Figure 9.
Figure 9.
The effects of Rab27A-Q78L and MyRIP on secretion depend on the state of the actin cortex. (A) Rhodamine-phalloidin staining of the actin cortex of PC12 cells. Compared with control conditions (left), the thickness of actin is reduced upon latrunculin B treatment (middle) and increased by jasplakinolide (right). (B) The secretory activity of PC12 cells transfected with vectors encoding GFP (as control), Rab27A-Q78L, wild-type MyRIP (MyRIP 1–859), MyRIP-ΔCter (1–665), or granuphilin was measured as in Fig. 5 by means of the [3H]5-HT release assay. Cells were incubated without addition of drug (Std, black bars) or in the presence of 1 μM jasplakinolide (Jasp, open bars) or 5 μM latrunculin B (Lat B, gray bars) for 20 min before and during stimulation of secretion. The effect of the different proteins on secretion was expressed, after subtracting the basal release of [3H]5-HT in normal saline, as percentage of the stimulus-dependent secretory response of GFP-transfected cells measured under the same conditions (i.e., in the absence of drug, in the presence of jasp, or in the presence of lat B). Shown are the results (mean ± SEM) of several independent experiments (the number of experiments is shown above the bars). Latrunculin B significantly reduced (P < 0.001) the inhibitory effects of Rab27A-Q78L and MyRIP on secretion, whereas jasplakinolide increased that of MyRIP (P < 0.001). The net release of GFP-transfected cells was 19 ± 2% of cellular [3H]5-HT in the absence of drug, 20 ± 2.2% in the presence of jasplakinolide, and 31 ± 3% in the presence of latrunculin B.
Figure 10.
Figure 10.
Rab27A and MyRIP control the motion of SGs beneath the plasma membrane. (A) Intact PC12 cell expressing NPY–GFP. The cell was illuminated by evanescent field with a penetration depth of 200 nm (in the cell) to visualize the NPY–GFP-containing SGs. The image is taken from a 1-min sequence acquired at 2 Hz (Video 5, available at http://www.jcb.org/cgi/content/full/jcb.200302157/DC1). (B) Series of images of the area delineated in A taken at 5-s intervals. (C) The granule marked with an arrow in B was tracked as described in the Materials and methods. Shown is the x,y trajectory. (D) Track of the granule marked with an arrowhead in B. Bars, 1 µm. (E) PC12 cells were cotransfected with NPY–GFP and Rab27A-Q78L or different MyRIP constructs. 3 d later, cells were imaged by EW-FM with a penetration depth of 200 nm (in the cell). SGs were tracked and the 2D diffusion coefficient (Dx,y) of each SG was calculated as described in the Materials and methods. Shown is the mean (±SEM) of Dx,y measured in mock-transfected (Control) and Rab27A-Q78L, MyRIP (1-859), MyRIP-RBD (1-134), and MyRIP-ΔCter (1-665) transfected cells. Latrunculin B (Lat B, right) increased the mean Dx,y of control cells. Moreover, under these conditions, the mobility of SGs from MyRIP-expressing cells was not different from that of mock-transfected cells. The number of tracked SGs is indicated above the bars. The significance of the differences was measured with Mann-Whitney U test.
Figure 10.
Figure 10.
Rab27A and MyRIP control the motion of SGs beneath the plasma membrane. (A) Intact PC12 cell expressing NPY–GFP. The cell was illuminated by evanescent field with a penetration depth of 200 nm (in the cell) to visualize the NPY–GFP-containing SGs. The image is taken from a 1-min sequence acquired at 2 Hz (Video 5, available at http://www.jcb.org/cgi/content/full/jcb.200302157/DC1). (B) Series of images of the area delineated in A taken at 5-s intervals. (C) The granule marked with an arrow in B was tracked as described in the Materials and methods. Shown is the x,y trajectory. (D) Track of the granule marked with an arrowhead in B. Bars, 1 µm. (E) PC12 cells were cotransfected with NPY–GFP and Rab27A-Q78L or different MyRIP constructs. 3 d later, cells were imaged by EW-FM with a penetration depth of 200 nm (in the cell). SGs were tracked and the 2D diffusion coefficient (Dx,y) of each SG was calculated as described in the Materials and methods. Shown is the mean (±SEM) of Dx,y measured in mock-transfected (Control) and Rab27A-Q78L, MyRIP (1-859), MyRIP-RBD (1-134), and MyRIP-ΔCter (1-665) transfected cells. Latrunculin B (Lat B, right) increased the mean Dx,y of control cells. Moreover, under these conditions, the mobility of SGs from MyRIP-expressing cells was not different from that of mock-transfected cells. The number of tracked SGs is indicated above the bars. The significance of the differences was measured with Mann-Whitney U test.

References

    1. Axelrod, D. 1981. Cell–substrate contacts illuminated by total internal reflection fluorescence. J. Cell Biol. 89:141–145. - PMC - PubMed
    1. Bahadoran, P., E. Aberdam, F. Mantoux, R. Busca, K. Bille, N. Yalman, G. de Saint-Basile, R. Casaroli-Marano, J.P. Ortonne, and R. Ballotti. 2001. Rab27a: a key to melanosome transport in human melanocytes. J. Cell Biol. 152:843–850. - PMC - PubMed
    1. Barral, D.C., J.S. Ramalho, R. Anders, A.N. Hume, H.J. Knapton, T. Tolmachova, L.M. Collinson, D. Goulding, K.S. Authi, and M.C. Seabra. 2002. Functional redundancy of Rab27 proteins and the pathogenesis of Griscelli syndrome. J. Clin. Invest. 110:247–257. - PMC - PubMed
    1. Bhakdi, S., U. Weller, I. Walev, E. Martin, D. Jonas, and M. Palmer. 1993. A guide to the use of pore-forming toxins for controlled permeabilization of cell membranes. Med. Microbiol. Immunol. (Berl.). 182:167–175. - PubMed
    1. Darchen, F., A. Zahraoui, F. Hammel, M.P. Monteils, A. Tavitian, and D. Scherman. 1990. Association of the GTP-binding protein Rab3A with bovine adrenal chromaffin granules. Proc. Natl. Acad. Sci. USA. 87:5692–5696. - PMC - PubMed

Publication types

MeSH terms