. 2003 Nov 10;163(3):661-71.
doi: 10.1083/jcb.200307061.

MT1-MMP-dependent, apoptotic remodeling of unmineralized cartilage: a critical process in skeletal growth

Affiliations

MT1-MMP-dependent, apoptotic remodeling of unmineralized cartilage: a critical process in skeletal growth

Kenn Holmbeck et al. J Cell Biol. .

Abstract

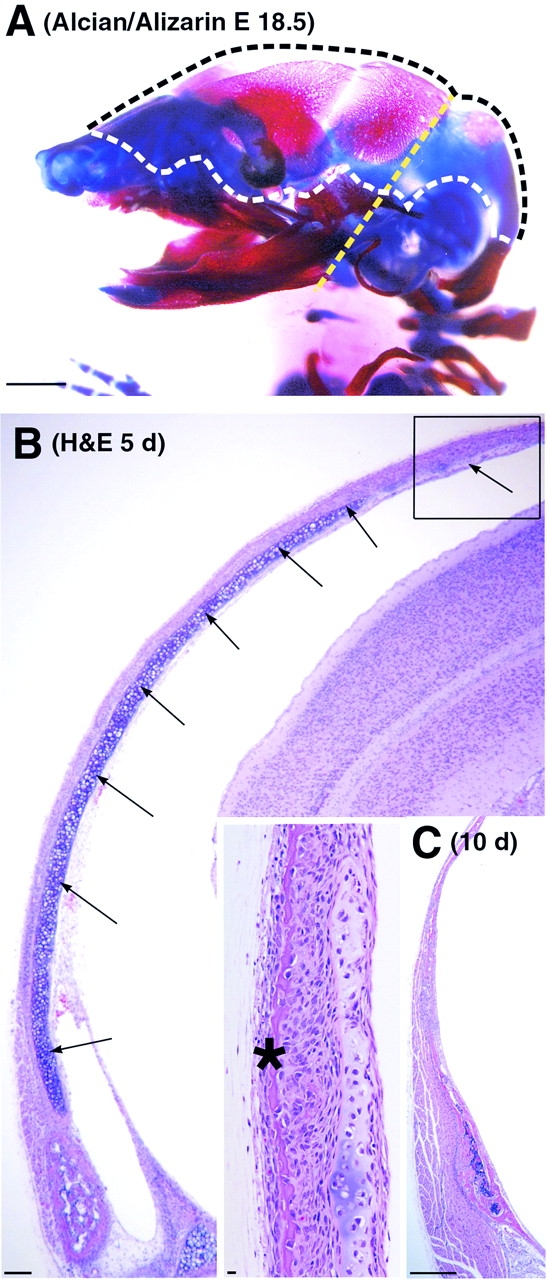
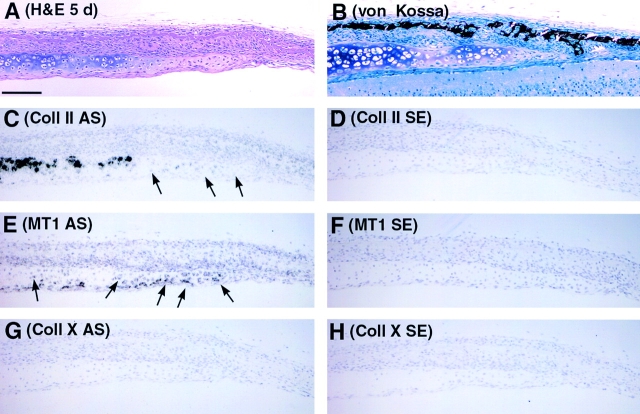
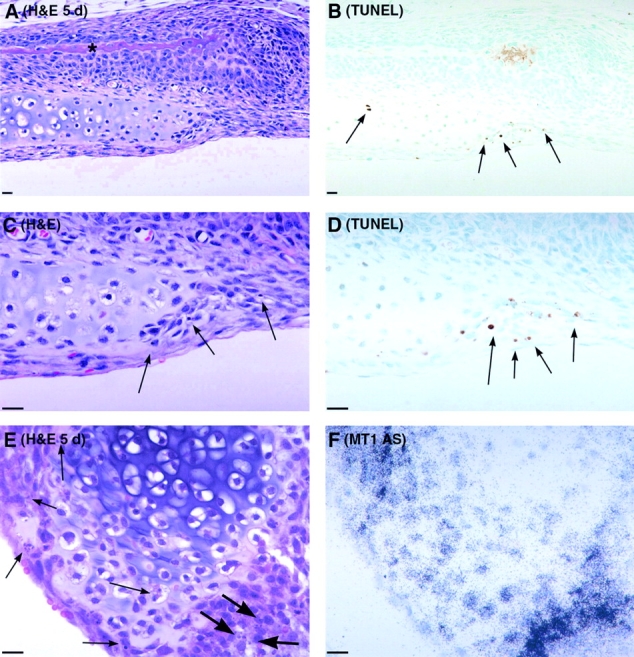
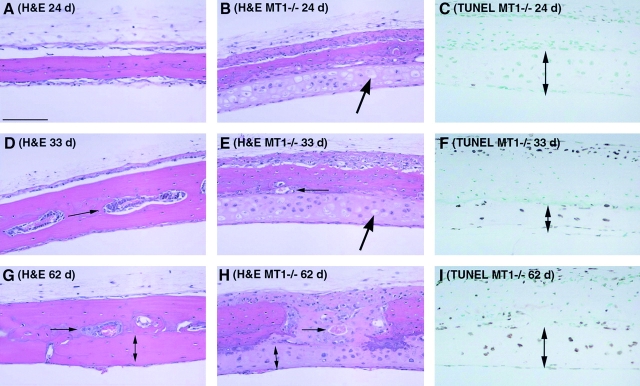
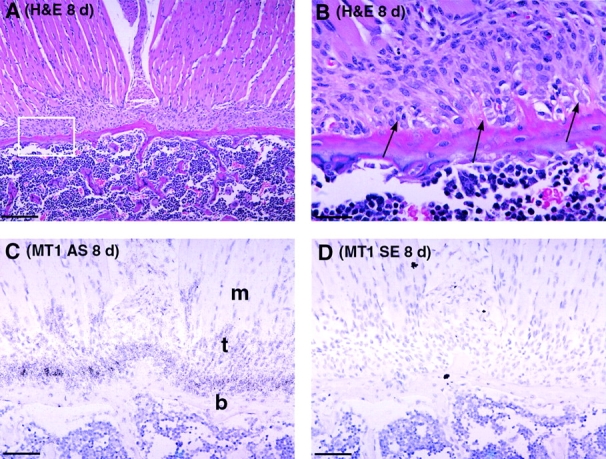
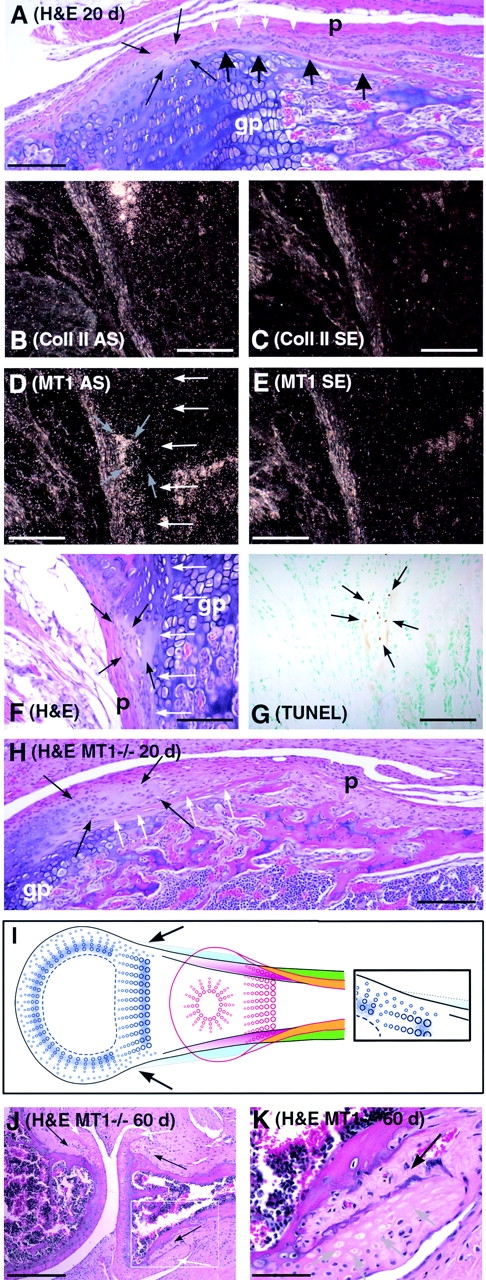
Skeletal tissues develop either by intramembranous ossification, where bone is formed within a soft connective tissue, or by endochondral ossification. The latter proceeds via cartilage anlagen, which through hypertrophy, mineralization, and partial resorption ultimately provides scaffolding for bone formation. Here, we describe a novel and essential mechanism governing remodeling of unmineralized cartilage anlagen into membranous bone, as well as tendons and ligaments. Membrane-type 1 matrix metalloproteinase (MT1-MMP)-dependent dissolution of unmineralized cartilages, coupled with apoptosis of nonhypertrophic chondrocytes, mediates remodeling of these cartilages into other tissues. The MT1-MMP deficiency disrupts this process and uncouples apoptotic demise of chondrocytes and cartilage degradation, resulting in the persistence of "ghost" cartilages with adverse effects on skeletal integrity. Some cells entrapped in these ghost cartilages escape apoptosis, maintain DNA synthesis, and assume phenotypes normally found in the tissues replacing unmineralized cartilages. The coordinated apoptosis and matrix metalloproteinase-directed cartilage dissolution is akin to metamorphosis and may thus represent its evolutionary legacy in mammals.


Figures

Figure 1.
Figure 1.
Morphology of cartilage anlagen and membranous bones in the wild-type mouse calvarium. (A) Gross morphology of the skull of an E18.5-d-old mouse embryo stained with alizarin red/alcian blue. The dotted line marks the region of membranous ossification. Note the extensive cartilaginous anlagen in the region where parietal and interparietal bones develop. The yellow dotted line indicates the plane of sectioning used in preparing histological material, as shown in B. (B) Section through the skull of a 5-d-old mouse, demonstrating the parietal cartilage (arrows) and the leading edge of the developing parietal bone (inset, asterisk). The inset shows a higher magnification of the area boxed in B. Note that parietal bone grows outside of the parietal cartilage rudiment. The cartilage matrix is not stained by hematoxylin (has lost the basophilia that indicates a normal proteoglycan content) in the region where membranous ossification is in progress. (C) Low-power magnification of parietal bone from 10-d-old wild-type mouse demonstrating complete removal of the parietal cartilage. Bars: (A) 1 mm; (B) 100 μm; (B, inset) 10 μm; (C) 333 μm.
Figure 2.
Figure 2.
Nonendochondral fate of calvarial cartilages. Sections of calvarial cartilages from 5-d-old wild-type mice. (A) Hematoxylin and eosin (H&E) staining; (B) von Kossa staining; (C, E, and G) in situ hybridization with antisense probes specific for Type II collagen (C); MT1-MMP (E); and Type X collagen (G) mRNAs. (D, F, and H) Control hybridization with sense probes Type II collagen (D), MT1-MMP (F), and Type X collagen (H). All sections, except the one shown in B, are serial sections from the same sample. Expression of type II collagen mRNA (C) is observed in the basophilic region of the cartilage, but has ceased in the apical portion (arrows), which is devoid of proteoglycan and appears nonbasophilic in H&E-stained sections (A). In the same location, expression of type X collagen cannot be detected (G), and von Kossa staining is negative for mineral in the cartilage (B), indicating that chondrocytes do not progress to hypertrophy and matrix mineralization. (E) MT1-MMP is particularly strongly expressed in this region (arrows), but not in those chondrocytes that reside in the basophilic area of the cartilage and express type II collagen. Bar, 100 μm.
Figure 3.
Figure 3.
Apoptosis of nonhypertrophic chondrocytes in calvarial cartilages coincides with MT1-MMP expression. Sections from 5-d-old wild-type mouse. (A, C, and E) Hematoxylin and eosin (H&E) staining. (B and D) TUNEL staining. (F) In situ hybridization specific for MT1-MMP mRNA. (A) Section demonstrating regression of the calvarial cartilage proximate to the emerging parietal bone (asterisk). (B–D) Apoptotic bodies and TUNEL-positive nuclei in the chondrocytes of the regressing calvarial cartilages (arrows). (E and F) Detail of similar process from other areas demonstrating multiple apoptotic bodies (E, arrows), and serial section (F) demonstrating robust expression of MT1-MMP mRNA in cells undergoing apoptosis. Note that apoptotic chondrocytes and sites of MT1-MMP expression specifically correspond to nonbasophilic areas of cartilage. Bars, 10 μm.
Figure 4.
Figure 4.
Persistence of ghost calvarial cartilages and delayed apoptosis of resident chondrocytes in MT1-MMP–deficient mice. Inability to remove calvarial cartilages leaves permanent vestiges thereof in MT1-MMP–deficient mice. In MT1-MMP–deficient mice, these structures (C, F, H, and I, double-headed arrow) precisely replace the inner plate of parietal bones (G, double-headed arrow); i.e., the bone located on the inner side of the vascular and marrow spaces (D, E, G, and H, horizontal arrows). Apoptotic demise of resident chondrocytes is markedly delayed, but progressively increases with age, and continues up to 62 d after birth; i.e., 52 d after the complete removal of the entire cartilage in wild-type mice (C, F, and I). Apoptotic chondrocytes leave behind empty chondrocytic lacunae (B and E, large arrows). Removal of the matrix does not occur, and a characteristic ghost cartilage morphology results from the combination of loss of basophilia, partial loss of chondrocytes, and retention of the matrix scaffold. (A–C) 24 d; (D–F) 33 d; (G–I) 62 d. Bar, 100 μm.
Figure 5.
Figure 5.
The nonendochondral fate of Meckel's cartilage (MC) is MT1-MMP dependent. (A–F) Wild-type mouse. (G–K) MT1-MMP–deficient mice. In wild-type mice (A and B), MC is conspicuous at E16.5. The rostral portion of MC (A, black arrows) undergoes hypertrophy and endochondral ossification, while the midportion (A, white arrow) is replaced by membranous bone, and its posterior portion (A, gray arrow) by the sphenomandibular ligament (detailed view of MC [arrows], malleus [m], and incus [i] shown in B). Both processes are completed in the wild-type mouse by day 5, when only small residual portions of MC can be observed after thorough sectioning of the mandible (C, arrows). The nonbasophilic peripheral portions of these islands contain multiple apoptotic chondrocytes (D, arrows). MT1-MMP mRNA (E and F, arrows) is expressed in chondrocytes residing in the dissolving matrix next to the mandibular bone (E and F, mb). Extensive remnants of MC are retained in 6-d-old MT1-MMP–deficient mice (G–K, black and white arrows), and older. MC remnants have lost basophilia (proteoglycan content), and significant numbers of chondrocytes, thus appearing as a ghost cartilage with multiple empty chondrocyte lacunae, best seen in I (mc). (G) Sagittal section of the hemi-mandible demonstrating molars (m), MC (black and white arrows), and mandibular bone (mb). (H–K) Coronal sections through the mouse skull. I and K are higher magnification views of MC remnants shown in H and J. t, tongue; i, lower incisor; m, mandible; mc, Meckel's cartilage; n, nerve. (A–B) Whole-mount alcian blue staining. (C, E, G–K) Hematoxylin and eosin (H&E)–stained sections. (D) TUNEL staining. (F) In situ hybridization for MT1-MMP. Bars: (A) 1 mm; (B) 0.5 mm; (C–G, and K) 100 μm; (I) 40 μm; (H and J) 200 μm.
Figure 6.
Figure 6.
MT1-MMP and apoptosis-dependent remodeling of cartilage at interfaces with other connective tissues. (A and B) 60-d-old wild-type mouse and MT1-MMP– deficient littermates, respectively. (A) Demonstrates the normal morphology at the site of insertion of the anterior cruciate ligament (cl) in the tibia. Note the direct transitions between articular cartilage (ac), bone, and ligament; boundary indicated by arrows. (B) Demonstrates the severe disease observed in MT1-MMP–deficient mice at transition points (magnified in inset, defined by white frame). Note the large portion of ghost cartilage (large arrows and inset) and the extensive adhesive and fibrotic changes in the surrounding tissues. Small arrow indicates the compromised transition point. In the inset, small arrows indicate the multiple empty chondrocyte lacunae of the ghost cartilage. (C–H) Serial sections through the insertion of cruciate ligaments (cl) in the knee joint of 20-d-old wild-type mouse. (C) Hematoxylin and eosin (H&E)–stained section demonstrating the direct transition between articular cartilage (ac) and cruciate ligament (cl). (D) TUNEL staining demonstrating apoptotic cells at the transition point (arrows). E and G, expression of type II collagen and MT1-MMP mRNA, respectively. Type II collagen is abundantly expressed in articular chondrocytes. In contrast, expression of MT1-MMP is most intense in the transition point and areas below (G, arrows). F and H are sense probes for type II collagen and MT1-MMP, respectively. Bars, 50 μm.
Figure 7.
Figure 7.
MT1-MMP expression at tendon bone interface in 8-d-old wild-type mouse. (A and B) Hematoxylin and eosin (H&E) stain. (C and D) In situ hybridization specific for MT1-MMP mRNA. (C) Antisense probe; (D) sense control. MT1-MMP is highly expressed in the transition between muscle (m), tendon (t), and bone (b) (A; and detailed view in B of area boxed in A). Note the characteristic Sharpey's fibers (B, arrows). Bars: (A) 100 μm; (B) 25 μm; (C and D) 40 μm.
Figure 8.
Figure 8.
MT1-MMP and apoptosis-dependent remodeling of cartilage in long bone growth. (A) Hematoxylin and eosin (H&E)–stained section of femur from a 20-d-old wild-type mouse; small black arrows indicate point of matrix remodeling. Large black arrows indicate boundary of mineralized cartilage; white arrows indicate proliferating osteogenic cells. gp, growth plate; p, periosteum. (B–G) Serial sections from the same animal hybridized with antisense probe for type II collagen (B), antisense probe for MT1-MMP (D), sense probe for type II collagen (C), and sense probe for MT1-MMP (E). (F) H&E; (G) TUNEL stain. Coincident loss of proteoglycan (F, arrows), chondrocyte apoptosis (G, arrows), expression of MT1-MMP (D, gray arrows), and cessation of type II collagen expression are observed at the transition point between unmineralized epiphyseal cartilage and the leading edge of periosteal ossification. (D, F, and H, white arrows) Border with mineralized cartilage. (H) Femur from 20-d-old MT1-MMP–deficient littermate stained with H&E. Note the presence of ghost cartilage at the junction of epiphyseal cartilage and periosteum (black arrows). (I) Schematic representation of endochondral and nonendochondral remodeling during long bone growth adapted from Gray's Anatomy (Warwick and Williams, 1973). In the smaller bone, cortex is shown in orange. During long bone growth, unmineralized cartilage (unshaded small blue circles and inset) is remodeled directly into bone (pink) continuous with existing bone (green). The expanse of the cartilage matrix remodeled directly into bone during growth from a small bone (red) to a larger bone (black) is indicated by dotted lines and turquoise shading. Outside of the growth plate, arrows identify the position of direct remodeling of unmineralized cartilage into an osteogenic tissue at the leading edge of periosteal ossification (regions known as the groove of Ranvier, inset). Nonhypertrophic chondrocytes are depicted as small blue circles. Hypertrophic chondrocytes and mineralized cartilage is depicted as larger circles shaded blue. (J and K) Long-term consequences of MT1-MMP deficiency for cartilage remodeling. Elbow joint of a 60-d-old MT1-MMP–deficient mouse. Both radius and humerus show extensive areas of unremodeled ghost cartilage (white arrows) that are continuous with articular surfaces and undermined by (osteoclastic) resorption of the underlying, mineralized subarticular cartilage (black arrows). (K) Detail of the area boxed in J. Resorption of mineralized subarticular cartilage occurs immediately underneath the tidemark (black arrow), and the unremodeled articular ghost cartilage displays numerous empty chondrocyte lacunae (gray arrows). Bars: (A–H) 100 μm; (J) 200 μm; (K) 27 μm.
Figure 9.
Figure 9.
Cell fate in ghost cartilages. (A–H) Calvarial sections from 33-d-old MT1-MMP–deficient mouse. (A, C, and D) Hematoxylin and eosin (H&E) staining; (B) BrdU labeling. (E) In situ hybridization with antisense probe detecting type I collagen mRNA. (F) Sense probe for type I collagen. (G) In situ hybridization with antisense probe specific for osteocalcin mRNA. (H) Sense probe for osteocalcin. (I) von Kossa–stained calvarial section from a 49-d-old MT1-MMP–deficient mouse. (A) 23 d after the time of complete removal of parietal cartilages in wild-type mice, the skull bone (asterisk) in mutant animals is still lined with cartilage. Some chondrocytes in ghost parietal cartilages (MT1-MMP–deficient mouse) have escaped apoptosis (A, arrow), and remained capable of DNA synthesis as shown by BrdU labeling (B, arrow). Some chondrocytes undergo mitosis (C and D, small arrows), leading to formation of pairs of chondrocytes in a single lacuna (C, large arrow). Other chondrocytes undergo apoptosis (D, large arrow). Besides resuming cell division, chondrocytes immobilized in ghost cartilages turn on the expression of type I collagen mRNA (E, arrows), and osteocalcin, a marker of late osteogenic differentiation (G, arrows). (I) At 49 d, extensive ectopic mineralization of the matrix has appeared in the ghost cartilage of MT1-MMP–deficient mice; some cells, presumably apoptotic, mineralize themselves (I, arrows). Bars: (A and B) 100 μm; (C) 25 μm; (D) 10 μm; (E–I) 50 μm.

Similar articles

Cited by

References

    1. Berry, D.L., C.S. Rose, B.F. Remo, and D.D. Brown. 1998. a. The expression pattern of thyroid hormone response genes in remodeling tadpole tissues defines distinct growth and resorption gene expression programs. Dev. Biol. 203:24–35. - PubMed
    1. Berry, D.L., R.A. Schwartzman, and D.D. Brown. 1998. b. The expression pattern of thyroid hormone response genes in the tadpole tail identifies multiple resorption programs. Dev. Biol. 203:12–23. - PubMed
    1. Bianco, P., A. Ponzi, and E. Bonucci. 1984. Basic and ‘special’ stains for plastic sections in bone marrow histopathology, with special reference to May-Grunwald Giemsa and enzyme histochemistry. Basic Appl. Histochem. 28:265–279. - PubMed
    1. Birkedal-Hansen, H. 1995. Proteolytic remodeling of extracellular matrix. Curr. Opin. Cell Biol. 7:728–735. - PubMed
    1. Blavier, L., A. Lazaryev, J. Groffen, N. Heisterkamp, Y.A. DeClerck, and V. Kaartinen. 2001. TGF-beta3-induced palatogenesis requires matrix metalloproteinases. Mol. Biol. Cell. 12:1457–1466. - PMC - PubMed

Publication types

MeSH terms

Substances