

Kinetics of lymphocyte proliferation during primary immune response in macaques infected with pathogenic simian immunodeficiency virus SIVmac251: preliminary report of the effect of early antiviral therapy
- PMID: 14610172
- PMCID: PMC262554
- DOI: 10.1128/jvi.77.23.12479-12493.2003
Kinetics of lymphocyte proliferation during primary immune response in macaques infected with pathogenic simian immunodeficiency virus SIVmac251: preliminary report of the effect of early antiviral therapy
Abstract
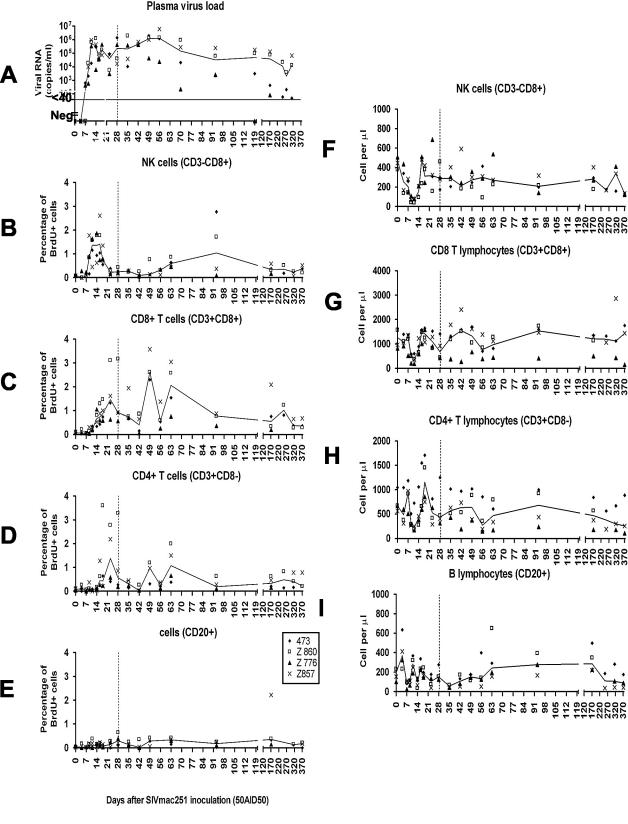
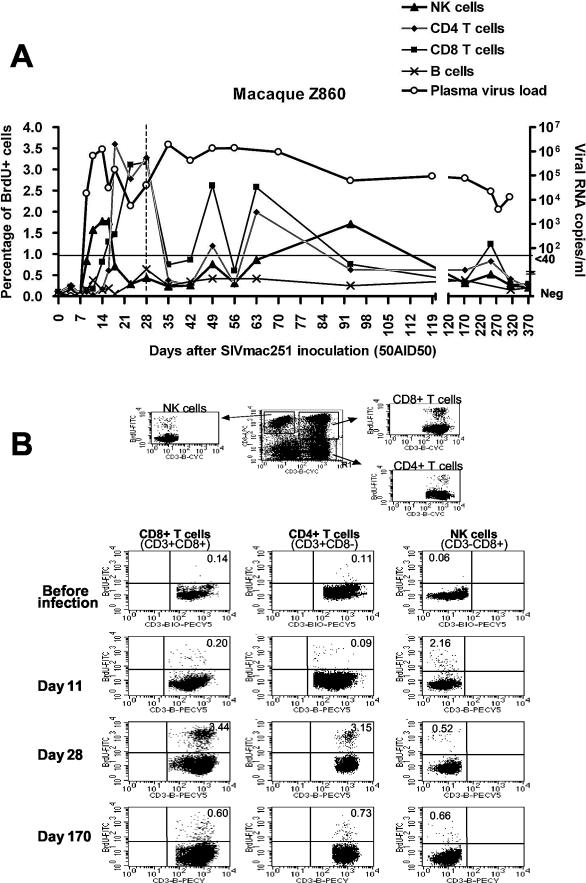
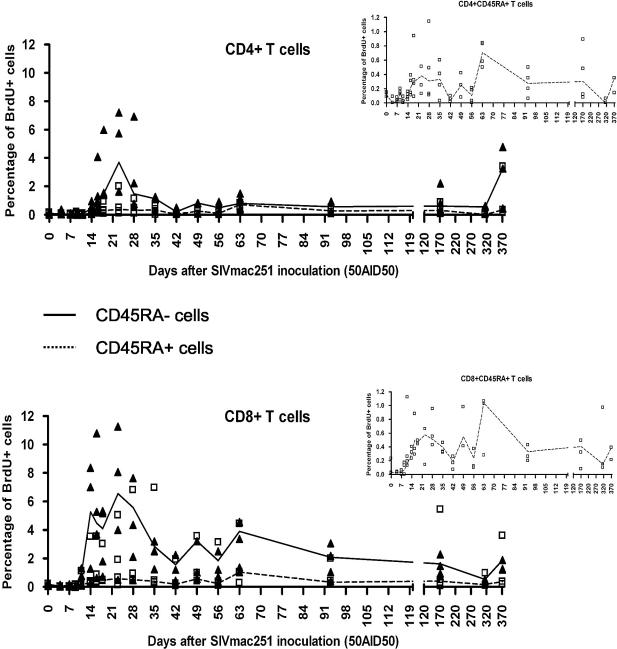
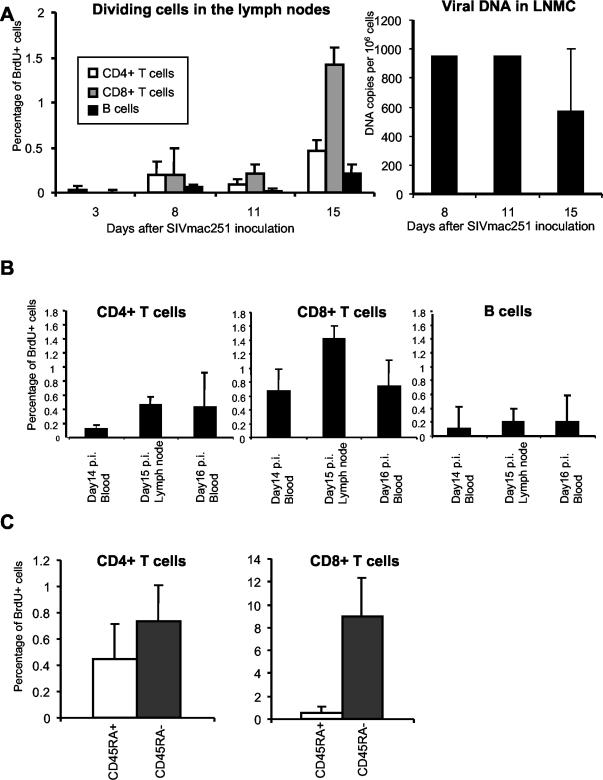
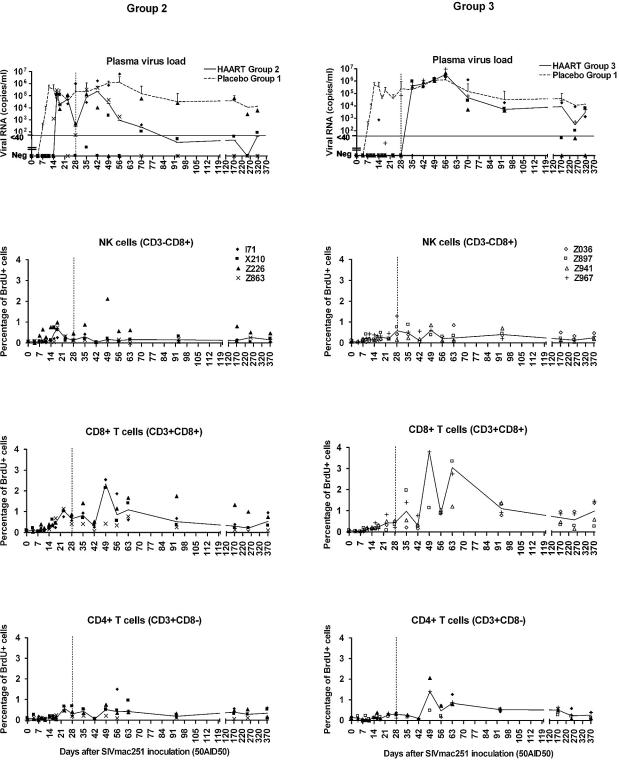
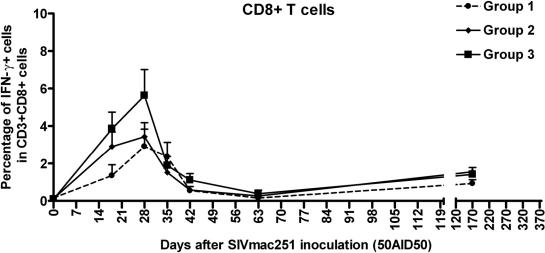
The aim of this study was to evaluate the kinetics of lymphocyte proliferation during primary infection of macaques with pathogenic simian immunodeficiency virus (SIV) and to study the impact of short-term postexposure highly active antiretroviral therapy (HAART) prophylaxis. Twelve macaques were infected by intravenous route with SIVmac251 and given treatment for 28 days starting 4 h postexposure. Group 1 received a placebo, and groups 2 and 3 received combinations of zidovudine (AZT), lamivudine (3TC), and indinavir. Macaques in group 2 received AZT (4.5 mg/kg of body weight), 3TC (2.5 mg/kg), and indinavir (20 mg/kg) twice per day by the oral route whereas macaques in group 3 were given AZT (4.5 mg/kg) and 3TC (2.5 mg/kg) subcutaneously twice per day, to improve the pharmacokinetic action of these drugs, and a higher dose of indinavir (60 mg/kg). The kinetics of lymphocyte proliferation were analyzed by monitoring 5-bromo-2'-deoxyuridine (BrdU) uptake ex vivo and by fluorescence-activated cell sorting analysis. HAART did not protect against SIV infection but did strongly impact on virus loads: viremia was delayed and lowered during antiviral therapy in group 2, with better control after treatment was stopped, and in group 3, viremia was maintained at lower levels during treatment, with virus even undetectable in the blood of some macaques, but there was no evidence of improved control of the virus after treatment. We provide direct evidence that dividing NK cells are detected earlier than dividing T cells in the blood (mostly in CD45RA(-) T cells), mirroring plasma viremia. Dividing CD8(+) T cells were detected earlier than dividing CD4(+) T cells, and the highest percentages of proliferating T cells coincided with the first evidence of partial control of peak viremia and with an increase in the percentage of circulating gamma interferon-positive CD8(+) T cells. The level of cell proliferation in the blood during SIV primary infection was clearly associated with viral replication levels because the inhibition of viral replication by postexposure HAART strongly reduced lymphocyte proliferation. The results and conclusions in this study are based on experiments in a small numbers of animals and are thus preliminary.
Figures
References
-
- Allen, T. M., D. H. O'Connor, P. Jing, J. L. Dzuris, B. R. Mothe, T. U. Vogel, E. Dunphy, M. E. Liebl, C. Emerson, N. Wilson, K. J. Kunstman, X. Wang, D. B. Allison, A. L. Hughes, R. C. Desrosiers, J. D. Altman, S. M. Wolinsky, A. Sette, and D. I. Watkins. 2000. Tat-specific cytotoxic T lymphocytes select for SIV escape variants during resolution of primary viraemia. Nature 407:386-390. - PubMed
-
- Barouch, D. H., S. Santra, J. E. Schmitz, M. J. Kuroda, T. M. Fu, W. Wagner, M. Bilska, A. Craiu, X. X. Zheng, G. R. Krivulka, K. Beaudry, M. A. Lifton, C. E. Nickerson, W. L. Trigona, K. Punt, D. C. Freed, L. Guan, S. Dubey, D. Casimiro, A. Simon, M. E. Davies, M. Chastain, T. B. Strom, R. S. Gelman, D. C. Montefiori, M. G. Lewis, E. A. Emini, J. W. Shiver, and N. L. Letvin. 2000. Control of viremia and prevention of clinical AIDS in rhesus monkeys by cytokine-augmented DNA vaccination. Science 290:486-492. - PubMed
-
- Borrow, P., H. Lewicki, X. Wei, M. S. Horwitz, N. Peffer, H. Meyers, J. A. Nelson, J. E. Gairin, B. H. Hahn, M. B. Oldstone, and G. M. Shaw. 1997. Antiviral pressure exerted by HIV-1-specific cytotoxic T lymphocytes (CTLs) during primary infection demonstrated by rapid selection of CTL escape virus. Nat. Med. 3:205-211. - PubMed
Publication types
MeSH terms
Substances
LinkOut - more resources
Full Text Sources
Research Materials
